
Page 92 - MI-1-1
P. 92
Microbes & Immunity Dynamics between phage, bacteria, and mammalian cells
A
B
C
D
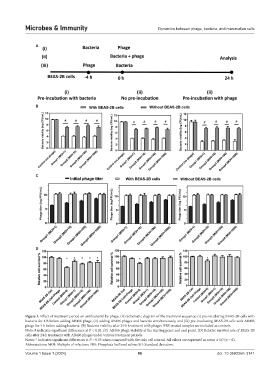
Figure 1. Effect of treatment period on antibacterial by phage. (A) Schematic diagram of the treatment sequence: (i) pre-incubating BEAS-2B cells with
bacteria for 4 h before adding AB406 phage, (ii) adding AB406 phages and bacteria simultaneously, and (iii) pre-incubating BEAS-2B cells with AB406
phage for 4 h before adding bacteria. (B) Bacteria viability after 24-h treatment with phages. PBS-treated samples are included as controls.
Note: # indicates significant differences at P < 0.01. (C) AB406 phage viability at the starting point and end point. (D) Relative survival rate of BEAS-2B
cells after 24-h treatment with AB406 phages under various treatment periods.
Notes: * indicates significant differences at P < 0.05 when compared with the only cell control. All values are expressed as mean ± SD (n = 6).
Abbreviations: MOI: Multiple of infection; PBS: Phosphate-buffered saline; SD: Standard deviation.
Volume 1 Issue 1 (2024) 86 doi: 10.36922/mi.3141