
Page 78 - MI-2-4
P. 78
Microbes & Immunity Dietary emulsifiers affect the presence of AIEC
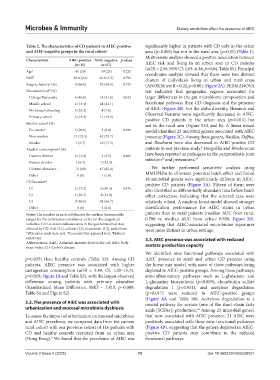
Table 2. The characteristics of CD patients in AIEC‑positive significantly higher in patients with CD only in the urban
and AIEC‑negative groups in the rural cohort area (p=0.003) but not in the rural area (p=0.31) (Table 1).
Multivariate analysis showed a positive association between
Characteristic AIEC‑positive AIEC‑negative p‑value
(n=15) (n=57) AIEC risk and living in an urban area in CD patients
Age † 45 (20) 39 (23) 0.220 (aOR = 2.56, 95% CI: 1.03–6.38, p=0.04, Table S5). Principal
coordinates analysis showed that there were two distinct
BMI † 20.8 (4.6) 20.8 (5.3) 0.792 clusters of individuals living in urban and rural areas
Surgery history (%) 9 (60.0) 29 (50.9) 0.735 (ANOSIM test R = 0.22, p=0.001, Figure 2A). PERMANOVA
‡
§
Education level (%) test indicated that geographic regions accounted for
College/University 6 (40.0) 18 (31.6) 0.023 larger differences in the gut microbiome composition and
Middle school 2 (13.3) 24 (42.1) functional pathways than CD diagnosis and the presence
No formal schooling 5 (33.3) 4 (7.0) of AIEC (Figure 2B). For the alpha diversity, Shannon and
Primary school 2 (13.3) 11 (19.3) Observed Features were significantly decreased in AIEC-
positive CD patients in the urban area (p=0.011) but
Smoker status (%) not in the rural area (Figure S3A and B). A linear mixed
§
Ex-smoker 3 (20.0) 5 (8.8) 0.400 model identified 23 microbial genera associated with AIEC
Non-smoker 11 (73.3) 42 (73.7) presence (Figure 2C). Among these genera, Bacillus, Delftia,
Smoker 1 (6.7) 10 (17.5) and Roseburia were also decreased in AIEC-positive CD
8
Alcohol consumption (%) patients in our previous study. Finegoldia and Rhodococcus
§
Current drinker 2 (12.3) 2 (3.5) 0.481 have been reported as pathogens in the periprosthetic joint
infection and pneumonia. 24
23
Former drinker 1 (6.7) 7 (12.3)
Lifetime abstainer 12 (80) 47 (82.4) We further performed sensitivity analysis using
Other 0 (0) 1 (1.8) MMUPHin to eliminate potential batch effect and found
CD Location § 16 microbial genera were significantly different in AIEC-
positive CD patients (Figure 3A). Fifteen of them were
L1 2 (13.3) 6 (10.5) 0.476 also identified as differentially abundant taxa before batch
L2 4 (26.7) 8 (14.0) effect correction, indicating that the selected taxa were
L3 9 (60.0) 38 (66.7) relatively robust. A random forest model showed stronger
Other 0 (0) 5 (8.8) classification performance for AIEC status in urban
Notes: The number in each cell denotes the median (interquartile patients than in rural patients (median AUC from rural:
range) for the continuous variables or n (%) for the categorical 0.700 vs. median AUC from urban: 0.850, Figure 3B),
variables. CD Location indicates areas in the gastrointestinal tract suggesting that AIEC-associated microbiome signatures
affected by CD: ileal (L1), colonic (L2), ileocolonic (L3), and others. were more distinct in urban settings.
‡
§
† Wilcoxon rank sum test; Pearson’s Chi-squared test; Fisher’s
exact test. 3.3. AIEC presence was associated with reduced
Abbreviations: AIEC: Adherent-invasive Escherichia coli; BMI: Body acetate production capacity
mass index; CD: Crohn’s disease.
We identified nine functional pathways associated with
p=0.035) than healthy controls (Table S2). Among CD AIEC presence in rural and urban CD patients using
patients, AIEC presence was associated with higher the linear mix model, with most of these pathways being
carrageenan consumption (aOR = 4.49, CI: 1.28–15.75, depleted in AIEC-positive groups. Among these pathways,
p=0.019, Figure 1B and Table S3), with the largest observed anti-inflammatory pathways such as L-glutamate and
difference among patients with primary education L-glutamine biosynthesis (p=0.009), chondroitin sulfate
(Standardized Mean Difference, SMD = 3.810, p=0.008; degradation I (p=0.031), and acetylene degradation
Table S4 and Figure S2). (p=0.017) were reduced in AIEC-positive groups
(Figure 4A and Table S6). Acetylene degradation is a
3.2. The presence of AIEC was associated with crucial pathway for acetate (one of the short-chain fatty
urbanization and mucosal microbiota dysbiosis acids [SCFAs]) production. Among 23 microbial genera
25
To assess the impact of urbanization on mucosal microbiota that were associated with AIEC presence, 21 AIEC were
and AIEC prevalence, we compared data from the current positively associated with these nine functional pathways
rural cohort with our previous cohort of 116 patients with (Figure 4B), suggesting that the genera depleted in AIEC-
CD and healthy controls recruited from an urban area positive CD patients may contribute to the reduced
(Hong Kong). We found that the prevalence of AIEC was functional pathways.
8
Volume 2 Issue 4 (2025) 70 doi: 10.36922/MI025230051