
Page 80 - MI-2-4
P. 80
Microbes & Immunity Dietary emulsifiers affect the presence of AIEC
A
C
B
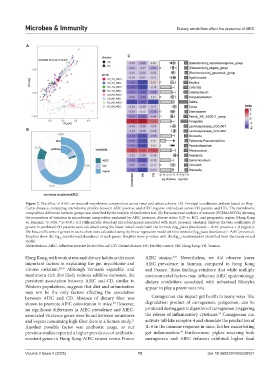
Figure 2. The effect of AIEC on mucosal microbiome composition across rural and urban cohorts. (A) Principal coordinates analysis based on Bray–
Curtis distance, comparing microbiome profiles between AIEC-positive and AIEC-negative individuals across CD patients and HCs. The microbiome
composition difference between groups was identified by the analysis of similarities test. (B) Permutational analysis of variance (PERMANOVA) showing
the proportion of variation in microbiome composition explained by AIEC presence, disease status (CD vs. HC), and geographic region (Hong Kong
vs. Yunnan). *p<0.05, **p<0.001. (C) Differentially abundant microbial genera associated with AIEC presence. Heatmap displays the beta coefficients of
genera in combined CD patients were calculated using the linear mixed model with the formula (log (taxa abundance) ~ AIEC presence + (1|region)).
10
The beta coefficients of genera in each cohort were calculated using the linear regression model with the formula (log (taxa abundance) ~ AIEC presence).
10
Boxplots show the log -transformed abundance of each genus. Boxplots show p-values with the log transformation identified from the linear mixed
10
10
model.
Abbreviations: AIEC: Adherent-invasive Escherichia coli; CD: Crohn’s disease; HC: Healthy control; HK: Hong Kong; YN: Yunnan.
Hong Kong, with work stress and dietary habits as the most AIEC strains. Nevertheless, we did observe lower
8,32
important factors in explaining the gut mycobiome and AIEC prevalence in Yunnan, compared to Hong Kong
virome variation. 28,29 Although Yunnan’s vegetable- and and France. These findings reinforce that while multiple
mushroom-rich diet likely reduces additive exposure, the environmental factors may influence AIEC epidemiology,
persistent association between AIEC and CD, similar to dietary emulsifiers associated with urbanized lifestyles
Western populations, suggests that diet and urbanization appear to play a prominent role.
may not be the only factors affecting the association
between AIEC and CD. Absence of dietary fiber was Carrageenan can impact gut health in many ways. The
shown to promote AIEC colonization in mice. However, degradation product of carrageenan, poligeenan, can be
30
no significant differences in AIEC prevalence and AIEC- produced during gastric digestion of carrageenan, triggering
33
associated virulence genes were found between omnivores the release of inflammatory cytokines. Carrageenan can
and vegans consuming high-fiber diets in a human study. activate toll-like receptor-4 and stimulate the production of
31
Another possible factor was antibiotic usage, as our IL-6 in the immune response in mice, further exacerbating
34
previous studies reported a higher prevalence of antibiotic- gut inflammation. Furthermore, piglets receiving both
resistant genes in Hong Kong AIEC strains versus France carrageenan and AIEC infusion exhibited higher fecal
Volume 2 Issue 4 (2025) 72 doi: 10.36922/MI025230051