
Page 37 - MSAM-1-2
P. 37
Materials Science in Additive Manufacturing Intense pulsed light sintering of conductive film
roughness indicator can be used to differentiate the were printed for each film thickness (number of layers).
delamination of sintered film effectively. For instance, for For each film thickness, the sintering distance was varied
the sintered film with no obvious delamination, the surface from 40 to 70 with a step increment of 5 (7 levels). Hence,
roughness indicator normally falls below 0.1 (S<0.1) as a total of 105 (7 × 5 × 3) samples were printed in this study.
shown in the two optical images (two different coupons)
in Figure 3A. For the moderately delaminated film which 2.6. A desirability function approach
has small, localized delamination, they normally fall in Here, a desirability function approach was used to transform
the range between 0.1 and 0.25. Figure 3B shows the two the two response variables (number of layers and sintering
different coupons that contain small, localized surface distance) into a single response variable function in 2D
anomalies with a surface roughness indicator, S close to design space. The optimal sintering process parameters
0.14. Finally, Figure 3C shows the coupons with severe could then be effectively evaluated by minimizing the
delamination issue with a surface roughness indicator single response function. To assess the desirability of the
value of higher than 0.3. contradicting responses quantitatively, each independent
2.5. Design of experiment response y is converted into an individual desirability
i
function, d. The desirability function, d, changes within
i
i
To investigate the effect of the photonic sintering parameters the range [0,1], where d = 0 indicates the independent
i
on the conductive ink printed with different thicknesses, response y is beyond the satisfactory range, and di = 1
i
two factors were considered in this study, namely, (1) the implies the independent response y achieves its target
i
sintering distance, which directly influences the light value. Depending on whether a specified response y is
i
intensity received by the conductive ink, and (2) the required to be reduced or increased, different desirability
number of layers of the conductive ink, which determines function d is utilized accordingly.
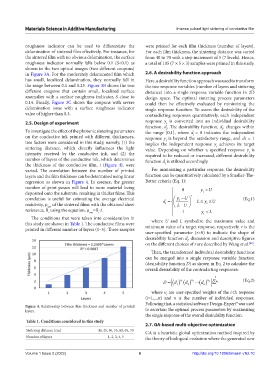
the thickness of the conductive film, t (Figure 4), were i
varied. The correlation between the number of printed For minimizing a particular response, the desirability
layers and the film thickness can be determined using linear function can be quantitatively calculated by a Smaller-The-
regression as shown in Figure 4. In essence, the greater Better criteria (Eq. 1):
number of print passes will lead to more material being 0 y >U
deposited onto the substrate, resulting in thicker films. This r i
correlation is useful for estimating the average electrical = d i −U y ≤ L ≤ y U (Eq.1)
resistivity, ρ of the sintered films with the obtained sheet i LU i
−
ave
resistance, R using the equation, ρ =R ∙t. 1 y i < L
s
ave
s
The conditions that were taken into consideration in
where U and L symbolize the maximum value and
this study are shown in Table 1. The conductive films were minimum value of a target response, respectively. r is the
printed in different number of layers (1–5). Three samples
user-specified parameter (r>0) to indicate the shape of
desirability function d, discussion and descriptive figures
i
on the different choices of r are described by Wang et al. .
[42]
Then, the transformed individual desirability functions
can be merged into a single response variable function
(desirability function D) as shown in Eq. 2 to calculate the
overall desirability of the contradicting responses:
1
D = ( ( ) ( ) d 1 1 u d 2 2 u ( ) ) ∑ i u (Eq.2)
n u
d
n
where u are user-specified weights of the i-th response
i
(i=1,...,n) and n is the number of individual responses.
Following that, a statistical software Design-Expert® was used
Figure 4. Relationship between film thickness and number of printed
layers. to ascertain the optimal process parameters by maximizing
the single response of the overall desirability function.
Table 1. Conditions considered in this study
2.7. GA-based multi-objective optimization
Sintering distance (cm) 40, 45, 50, 55, 60, 65, 70 GA is a heuristic global optimization method inspired by
Number of layers 1, 2, 3, 4, 5 the theory of biological evolution where the generated new
Volume 1 Issue 2 (2022) 6 http://doi.org/10.18063/msam.v1i2.10