
Page 42 - MSAM-1-2
P. 42
Materials Science in Additive Manufacturing Intense pulsed light sintering of conductive film
an individual point, particularly when prior knowledge Table 4 summarizes the system settings of the adopted
about the underlying optimization problem is unknown. multi-objective optimization approach. Based on the
In this case, the derived statistical models were jointly proposed flow chart, the optimization process will be
driven with the NSGA-III to systematically optimize the repeated if the employed NSGA-III does not reach its
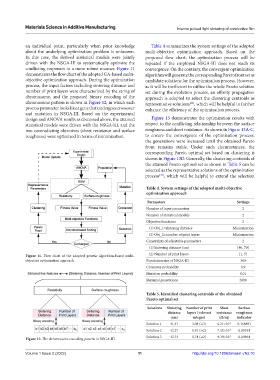
conflicting responses in a more robust manner. Figure 11 convergence. On the contrary, the convergent optimization
demonstrates the flow chart of the adopted GA-based multi- algorithm will generate the corresponding Pareto front set as
objective optimization approach. During the optimization candidate solutions for the optimization process. However,
process, the input factors including sintering distance and as it will be inefficient to utilize the whole Pareto solution
number of print layers were characterized by the string of set during the evolution process, an affinity propagation
chromosome, and the proposed binary encoding of the approach is adopted to select the clustering centroids as
chromosome pattern is shown in Figure 12, in which each representative solutions , which will be helpful to further
[49]
process parameter looks like a gene that undergoes crossover enhance the efficiency of the optimization process.
and mutation in NSGA-III. Based on the experimental
design and ANOVA results as discussed above, the attained Figure 13 demonstrates the optimization results with
statistical models were driven with the NSGA-III, and the respect to the conflicting relationship between the surface
two contradicting objectives (sheet resistance and surface roughness and sheet resistance. As shown in Figure 13A-C,
roughness) were optimized in terms of minimization. to ensure the convergence of the optimization process,
the generations were increased until the obtained Pareto
front remains stable. Under such circumstances, the
corresponding Pareto optimal set based on clustering is
shown in Figure 13D. Generally, the clustering centroids of
the attained Pareto optimal set as shown in Table 5 can be
selected as the representative solutions of the optimization
process , which will be helpful to extend the selection
[42]
Table 4. System settings of the adopted multi‑objective
optimization approach
Parameters Settings
Number of input parameters 2
Number of statistical models 2
Objective functions 2
(1) Obj_1=sintering distance Minimization
(2) Obj_2=number of print layers Minimization
Constraints of adjustable parameters 2
(1) Sintering distance (cm) [40, 70]
Figure 11. Flow chart of the adopted genetic algorithm-based multi- (2) Number of print layers [1, 5]
objective optimization approach. Population size of NSGA-III 300
Crossover probability 0.9
Mutation probability 0.01
Maximal generations 2000
Table 5. Identified clustering centroids of the obtained
Pareto optimal set
Solutions Sintering Number of print Sheet Surface
distance layers (→closest resistance roughness
(cm) integer) (Ω/sq) indicator
Solution 1 41.47 3.08 (→3) 6.31×10 -2 0.168891
Solution 2 42.27 1.91 (→2) 7.42×10 -2 0.09184
Solution 3 42.33 1.74 (→2) 9.30×10 -2 0.04964
Figure 12. The chromosome encoding pattern in NSGA-III.
Volume 1 Issue 2 (2022) 11 http://doi.org/10.18063/msam.v1i2.10