
Page 39 - MSAM-1-2
P. 39
Materials Science in Additive Manufacturing Intense pulsed light sintering of conductive film
Table 3. ANOVA results for surface roughness 0.7784B⁴ + 1.51A³B² − 0.6597A²B³ + 0.6386A⁴B +
2.86A⁵ -3.16A³B³ + 2.70A⁵B + 7.24A⁶
Source F‑value P‑value
where the high levels of the factors are coded as +1 and
Model 41.00 <0.0001 the low levels are coded as −1.
A-Sintering distance 57.09 <0.0001
B-Print layers 11.86 0.0009 It can be seen from Figure 8A that the slope of the
AB 13.17 0.0005 gradient for the sheet resistance over the number of print
layers increases as the sintering distance becomes larger. It
A² 3.48 0.0657 is observed that at lower number of print layers, the effect
B² 18.74 < 0.0001 of the sintering distance on the sheet resistance is extremely
A²B 0.8409 0.3618 prominent, in which larger sintering distance gives rise to
AB² 18.14 < 0.0001 higher sheet resistance. The effect becomes less prominent
A≥ 30.57 < 0.0001 as the number of print layers increases.
B≥ 4.53 0.0362 The surface roughness does not scale linearly with the
A²B² 23.99 < 0.0001 print layers nor the sintering distance (Figure 8B). A global
A≥B 0.0944 0.7594 peak is observed at print layer equal to three and sintering
AB≥ 23.35 < 0.0001 distance of 60 cm. The surface roughness drops sharply as
A⁴ 7.85 0.0063 the print layer reduces to 1 or sintering distance approaches
70 cm. The decrease is less drastic at higher print layers and
B⁴ 3.61 0.0610 sintering distance lower than 60 cm.
A≥B² 15.63 0.0002
For high quality sintered film, both the sheet resistance
A²B≥ 2.69 0.1049 and the surface roughness should be low. From Figure 9A,
A⁴B 1.86 0.1762 the sheet resistance is lowest in the region of high numbers
A⁵ 12.60 0.0006 of print layers and small sintering distance. The surface
A≥B≥ 17.61 < 0.0001 roughness, on the other hand, is lower at small number of
A⁵B 5.58 0.0205 print layers or at sintering distance of 70 cm (Figure 9B).
A⁶ 7.32 0.0083 The conflicting relationship results in a need to reach a
Residual compromise between the two parameters.
Lack of Fit 1.82 0.0569 To identify the optimum condition for high quality
R² 0.9121 sintered film, a desirability function approach was used (Eq.
2), where the multiple response variables were merged into a
Adjusted R² 0.8898 single response function established on a certain metric. In the
Predicted R² 0.8600 overall desirability function, the weights of sheet resistance
Adeq Precision 21.2984 and surface roughness were initialized with the same value.
A B
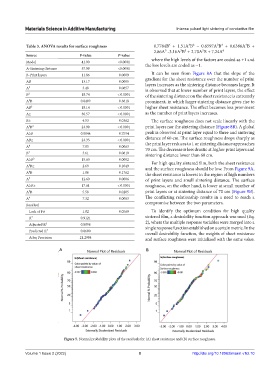
Figure 5. Normal probability plots of the residuals for (A) sheet resistance and (B) surface roughness.
Volume 1 Issue 2 (2022) 8 http://doi.org/10.18063/msam.v1i2.10