
Page 38 - MSAM-1-2
P. 38
Materials Science in Additive Manufacturing Intense pulsed light sintering of conductive film
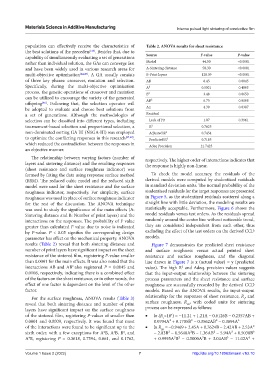
population can effectively receive the characteristics of Table 2. ANOVA results for sheet resistance
the best solutions of the precedent . Besides that, due to
[43]
capability of simultaneously evaluating a set of generations Source F‑value P‑value
rather than individual solution, the GAs can converge fast Model 44.50 <0.0001
and have been widely used in various research areas for A-Sintering distance 50.30 <0.0001
multi-objective optimization [44,45] . A GA usually consists B-Print layers 128.39 <0.0001
of three key phases: crossover, mutation and selection. AB 8.45 0.0045
Specifically, during the multi-objective optimization A² 0.5021 0.4803
process, the genetic operations of crossover and mutation B² 3.48 0.0650
can be utilized to encourage the variety of the generated AB² 6.75 0.0108
offspring . Following that, the selection operator will
[46]
be adopted to evaluate and choose best solutions from A≥ 4.39 0.0387
a set of generations. Although the methodologies of Residual
selection can be classified into different types, including Lack of Fit 1.07 0.3961
tournament-based selection and proportional selection, a R² 0.7625
non-dominated sorting GA III (NSGA-III) was employed Adjusted R² 0.7454
to optimize the conflicting responses in this research [47,48] , Predicted R² 0.7185
which reduced the contradiction between the responses in Adeq Precision 21.7425
an objective manner.
The relationship between varying factors (number of respectively. The higher order of interactions indicates that
layers and sintering distance) and the resulting responses the response is highly non-linear.
(sheet resistance and surface roughness indicator) was
formed by fitting the data using response surface method To check the model accuracy, the residuals of the
(RSM). The reduced cubic model and the reduced sixth derived models were computed by studentized residuals
model were used for the sheet resistance and the surface in standard deviation units. The normal probability of the
roughness indicator, respectively. For simplicity, surface studentized residuals for the target responses are presented
roughness was used in place of surface roughness indicator in Figure 5, as the studentized residuals scattered along a
for the rest of the discussion. The ANOVA technique straight line with little deviation, the modeling results are
was used to study the significance of the main effects (A: statistically acceptable. Furthermore, Figure 6 shows the
Sintering distance and B: Number of print layers) and the model residuals versus test orders. As the residuals spread
interactions on the responses. The probability of F value randomly around the center line without noticeable trend,
greater than calculated F value due to noise is indicated they are considered independent from each other, thus
by P-value. P < 0.05 signifies the corresponding design excluding the effect of the test orders on the derived CCD
parameter has effect on the mechanical property. ANOVA models.
results (Table 2) reveal that both sintering distance and Figure 7 demonstrates the predicted sheet resistance
number of print layers have significant impact on the sheet and surface roughness versus actual printed sheet
resistance of the sintered film, registering P-value smaller resistance and surface roughness, and the diagonal
than 0.0001 for the main effects. It was also noted that the line drawn in Figure 7 is x (actual value) = y (predicted
interactions AB and AB also registered P = 0.0045 and value). The high R and Adeq. precision values suggests
2
2
0.0108, respectively, indicating there is a combined effect that the input-output relationship between the sintering
of the factors on the sheet resistance, or in other words, the process parameters and the sheet resistance and surface
effect of one factor is dependent on the level of the other roughness are successfully recorded by the derived CCD
factor. models. Based on the ANOVA results, the input-output
For the surface roughness, ANOVA results (Table 3) relationship for the responses of sheet resistance, R , and
s
reveal that both sintering distance and number of print surface roughness, R , with coded units for sintering
SR
layers have significant impact on the surface roughness process can be expressed as follows:
of the sintered film, registering P-values of smaller than • ln (R ×10 ) = −11.21 + 1.21A − 0.6126B − 0.2357AB +
4
s
0.0001 and 0.0009, respectively. It was found that most 0.0704A² + 0.1705B² − 0.3562AB² − 0.3894A³
of the interactions were found to be significant up to the • ln R = −0.9469 + 2.45A + 0.7624B − 2.42AB + 2.53A²
SR
4
sixth order, with a few exceptions for A B, A B, B , and − 2.03B² − 0.5648A²B − 1.36AB² − 5.94A³ + 0.5038B³
2
3
A B, registering P = 0.3618, 0.7594, 0.061, and 0.1762, + 0.9995A²B² − 0.5000A³B + 3.04AB³ − 11.02A⁴ +
4
Volume 1 Issue 2 (2022) 7 http://doi.org/10.18063/msam.v1i2.10