
Page 18 - MSAM-1-4
P. 18
Materials Science in Additive Manufacturing Y O influence in heat-treated LPBF IN718 composite
2 3
A B
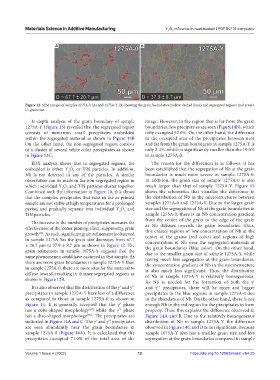
Figure 12. SEM images of samples 1275A-0 (A) and 1275A-Y (B) showing the grain boundaries (yellow dashed lines) and segregated regions (red areas).
D: grain size.
In-depth analysis of the grain boundary of sample image. However, in the region that is far from the grain
1275A-Y (Figure 13) revealed that the segregated region boundaries, few precipitates are seen (Figure14B), which
consists of numerous small precipitates embedded only occupied 52.0%. On the other hand, the difference
within the segregated material as shown in Figure 13B in the occupied area of the precipitates between near
On the other hand, the non-segregated region consists and far from the grain boundaries in sample 1275A-Y is
of a cluster of several white color precipitates as shown only 2.4%, which is significantly smaller than the 19.0%
in Figure 13C. in sample 1275A-0.
EDX analysis shows that in segregated regions, the The reason for the differences is as follows. It has
embedded is either Y O or TiN particles. In addition, been established that the segregation of Nb at the grain
3
2
Nb is not detected in any of the particles. A similar boundaries is much more severe in sample 1275A-0.
observation can be made in the non-segregated region in In addition, the grain size of sample 1275A-0 is also
which individual Y O and TiN particles cluster together. much larger than that of sample 1275A-Y. Figure 15
3
2
Combined with the information in Figure 10, this shows shows the schematics that visualize the difference in
that the complex precipitates that exist in the as-printed the distribution of Nb in the microstructures between
sample are not stable at high temperatures for a prolonged samples 1275A-0 and 1275A-Y. Due to the larger grain
period and gradually separate into individual Y O and size and the segregation of Nb at the grain boundaries in
2
3
TiN particles. sample 1275A-0, there is an Nb concentration gradient
from the center of the grain to the edge of the grain
The increase in the number of precipitates increases the
effectiveness of the Zener pinning effect, suppressing grain as Nb diffuses towards the grain boundaries. Thus,
this creates regions of low concentration of Nb at the
[56]
growth . As such, significant grain refinement is observed center of the grains (red color) and regions of high
in sample 1275A-Yas the grain size decreases from 67.7 concentration of Nb near the segregated materials at
± 20.7 µm to 37.9 ± 8.7 µm as shown in Figure 12. The the grain boundaries (blue color). On the other hand,
grain refinement in sample 1075A-Y suggests that the due to the smaller grain size of sample 1275A-Y, while
same phenomenon could have occurred in that sample. As having much less segregation at the grain boundaries,
there are more grain boundaries in sample 1275A-Y than the concentration gradient of Nb in the microstructure
in sample 1275A-0, there are more sites for the material to is also much less significant. Thus, the distribution
diffuse toward, resulting in thinner segregated regions as of Nb in sample 1275A-Y is relatively homogeneous.
shown in Figure 12B.
As Nb is needed for the formation of both the γ′
It is also observed that the distribution of the γ′ and γ′′ and γ′′ precipitates, there will be more and bigger
precipitates in sample 1275A-Y have less of a difference precipitates in the blue regions in sample 1275A-0 due
as compared to those in sample 1275A-0 as shown in to the abundance of Nb. On the other hand, there is not
Figure 14. It is generally accepted that the γ′ phase enough Nb in the red region for the precipitates to form
has a cube-shaped morphology [57] while the γ′′ phase properly. Thus, this explains the difference observed in
has a disc-shaped morphology [58] . The precipitates are Figure 14A and B. Due to the relatively homogeneous
indicated in Figure 14A and C. The γ′ and γ′′ precipitates distribution of Nb in sample 1275A-Y, the difference
are seen abundantly near the grain boundaries in observed in Figure 14C and D is not significant. Because
sample 1275A-0 (Figure 14A). It is calculated that the sample 1075A-Y also has a smaller grain size and less
precipitates occupied 71.0% of the total area of the segregation at the grain boundaries compared to sample
Volume 1 Issue 4 (2022) 12 https://doi.org/10.18063/msam.v1i4.25