
Page 115 - MSAM-2-3
P. 115
Materials Science in Additive Manufacturing SLA 3D printed triaxial nozzle
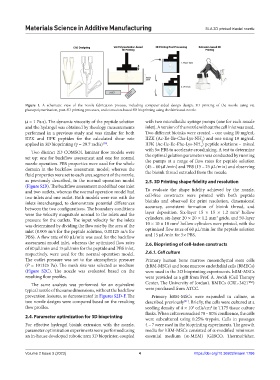
Figure 1. A schematic view of the nozzle fabrication process, including computer-aided design design, 3D printing of the nozzle using vat
photopolymerization, post-3D printing processes, and extrusion-based 3D bioprinting using the fabricated nozzle.
μ = 1 Pa∙s). The dynamic viscosity of the peptide solution with two microfluidic syringe pumps (one for each nozzle
and the hydrogel was obtained by rheology measurements inlet). A version of the nozzle without the cell inlet was used.
performed in a previous study and was similar for both Two different bioinks were created – one using 10 mg/mL
IIZK and IIFK peptides for the calculated shear rate IIZK (Ac-Ile-Ile-Cha-Lys-NH ) and one using 10 mg/mL
2
applied in 3D bioprinting (γ = 29.7 rad/s) . IIFK (Ac-Ile-Ile-Phe-Lys-NH ) peptide solutions – mixed
[30]
2
with 5× PBS to accelerate crosslinking. A test to determine
Two distinct 2D COMSOL laminar flow models were
set up: one for backflow assessment and one for normal the optimal gelation parameters was conducted by running
the pumps at a range of flow rates for peptide solution
nozzle operation. PBS properties were used for the whole (45 – 60 μL/min) and PBS (15 – 25 μL/min) and observing
domain in the backflow assessment model; whereas the the bioink thread extruded from the nozzle.
fluid properties were set to each area segment of the nozzle,
as previously described, in the normal operation model 2.5. 3D Printing shape fidelity and resolution
(Figure S2B). The backflow assessment model had one inlet
and two outlets, whereas the normal operation model had To evaluate the shape fidelity achieved by the nozzle,
two inlets and one outlet. Both models were run with the cell-free constructs were printed with both peptide
inlets interchanged, to demonstrate potential differences bioinks and observed for print resolution, dimensional
between the two configurations. The boundary conditions accuracy, consistent formation of bioink thread, and
3
were the velocity magnitude normal to the inlets and the layer deposition. Six-layer 15 × 15 × 1.2 mm hollow
3
pressure for the outlets. The input velocity for the inlets cylinders, six-layer 20 × 20 × 1.2 mm grids, and 50-layer
3
was determined by dividing the flow rate by the area of the 10 × 10 × 10 mm hollow cylinders were printed, with the
inlet (0.005 m/s for the peptide solution, 0.00125 m/s for optimized flow rates of 60 μL/min for the peptide solution
PBS). A flow rate of 60 μL/min was used for the backflow and 15 μL/min for 5× PBS.
assessment model inlet, whereas the optimized flow rates 2.6. Bioprinting of cell-laden constructs
of 60 μL/min and 15 μL/min for the peptide and PBS inlet,
respectively, were used for the normal operation model. 2.6.1. Cell culture
The outlet pressure was set to the atmospheric pressure Primary human bone marrow mesenchymal stem cells
(P = 101325 Pa). The mesh size was selected as medium (hBM-MSCs) and bone marrow endothelial cells (BMECs)
(Figure S2C). The nozzle was evaluated based on the were used in the 3D bioprinting experiments. hBM-MSCs
resulting flow profiles. were provided as a gift from Prof. A. Awidi (Cell Therapy
The same analysis was performed for an equivalent Center, The University of Jordan). BMECs (CRL-3421™)
typical nozzle of the same dimensions, without the backflow were purchased from ATCC.
prevention features, as demonstrated in Figures S2D-F. The Primary hBM-MSCs were expanded in culture, as
two nozzle designs were compared based on the resulting described previously . Briefly, the cells were cultured at a
[31]
flow profiles. seeding density of 4 × 10 cells/cm in T175 tissue culture
3
2
flasks. When cultures reached 70 – 80% confluence, the cells
2.4. Parameter optimization for 3D bioprinting were subcultured using 0.25% trypsin. Cells in passages
For effective hydrogel bioink extrusion with the nozzle, 4 – 7 were used in the bioprinting experiments. The growth
parameter optimization experiments were performed using media for hBM-MSCs consisted of α-modified minimum
an in-house developed robotic arm 3D bioprinter, coupled essential medium (α-MEM) (GIBCO, ThermoFisher,
Volume 2 Issue 3 (2023) 4 https://doi.org/10.36922/msam.1786