
Page 82 - MSAM-2-4
P. 82
Materials Science in Additive Manufacturing Laser DED-produced Ti-6Mn-4Mo alloy
Figure 4. Heat treatment scheme for Ti-6Mn-4Mo samples.
relative values normalized to the theoretical density for
Ti-6Mn-4Mo alloy. The theoretical density was calculated
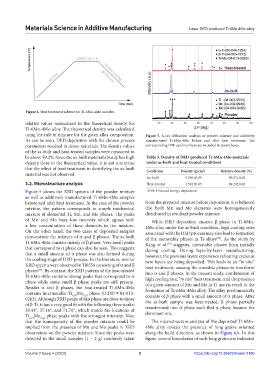
using the rule of mixture for the given alloy composition. Figure 5. X-ray diffraction analysis of powder mixture and additively
As can be seen, DED deposition with the chosen process manufactured Ti-6Mn-4Mo before and after heat treatment. The
parameters resulted in dense materials. The density values corresponding PDF card numbers are included in parentheses.
of the as-built and heat-treated samples were measured to
be above 99.2%. Since the as-built material already has high Table 3. Density of DED‑produced Ti‑6Mn‑4Mo materials
density close to the theorectical value, it is not a surprise under as‑built and heat‑treated conditions
that the effect of heat treatment in densifying the as-built Condition Density (g/cm ) Relative density (%)
3
material was not observed.
As-built 4.596±0.05 99.27±0.02
3.2. Microstructure analysis Heat-treated 4.593±0.05 99.20±0.02
Figure 5 shows the XRD spectra of the powder mixture DED: Directed energy deposition
as well as additively manufactured Ti-6Mn-4Mo samples
before and after heat treatment. In the case of the powder from the prepared mixture before deposition, it is believed
mixture, the pattern corresponds to simple mechanical that both Mn and Mo elements were homogeneously
mixture of elemental Ti, Mn, and Mo phases. The peaks distributed in resultant powder mixture.
of Mn and Mo have low intensity which agrees with While DED deposition ensures β phase in Ti-6Mn-
a low concentration of these elements in the mixture. 4Mo alloy under the as-built condition, high cooling rates
On the other hand, the two cases of deposited samples associated with the DED process may also lead to formation
demonstrate the mixture of α and β phases. The as-built of the metastable phases in Ti-alloys . As the study by
[39]
Ti-6Mn-4Mo consists mainly of β phase. Very small peaks Kang et al. suggests, metastable phases form initially
[37]
that correspond to α phase can also be seen. This suggests during cooling. During layer-by-layer manufacturing,
that a small amount of α phase was also formed during however, the previous layers experience reheating cycles as
the cooling stage of DED process. In the literature, similar new layers are being deposited. This leads to an “in situ”
XRD spectra were observed in Ti6554 consisting of α and β heat treatment, causing the unstable phases to transform
[38]
phases . By contrast, the XRD pattern of the heat-treated into α and β phases. In the present study, combination of
Ti-6Mn-4Mo contains strong peaks that correspond to α high cooling rate, “in situ” heat treatment, and the presence
phase while some small β phase peaks are still present. of a given amount of Mn and Mo in Ti matrix result in the
Besides α and β phases, the heat-treated Ti-6Mn-4Mo formation of Ti-6Mn-4Mo alloy. The alloy predominantly
contains intermetallic Ti Mo phase (ICDD # 04-013- consists of β phase with a small amount of α phase. After
0.75
0.25
0263). Although XRD peaks of this phase are close to those the as-built sample was heat-treated, β phase partially
of β-Ti, it has a very good fit with the following three peaks: transformed into α phase such that α phase became the
39.44°, 57.16°, and 71.70°, which match the locations of dominant one.
Ti Mo phase peaks with the strongest intensity. Note
0.25
0.75
that the homogeneity of the powder mixture could be The microstructure analysis of the deposited Ti-6Mn-
implied from the presence of Mn and Mo peaks in XRD 4Mo alloy reveals the presence of long grains oriented
observation on the powder mixture. Since the peaks were along the build direction, as shown in Figure 6A. In this
detected in the small samples (1 – 2 g) randomly taken figure, several boundaries of such long grains are indicated
Volume 2 Issue 4 (2023) 5 https://doi.org/10.36922/msam.2180