
Page 84 - MSAM-2-4
P. 84
Materials Science in Additive Manufacturing Laser DED-produced Ti-6Mn-4Mo alloy
A B A
C D
B
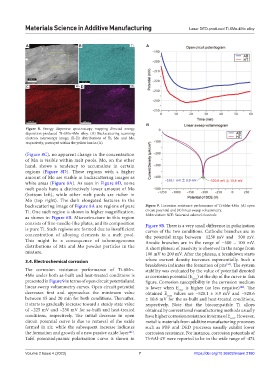
Figure 8. Energy dispersive spectroscopy mapping directed energy
deposition-produced Ti-6Mn-4Mo alloy. (A) Backscattering scanning
electron microscopy image; (B-D) distributions of Ti, Mn and Mo,
respectively, portrayed within the yellow box in (A).
(Figure 8C), no apparent change in the concentration
of Mn is visible within melt pools. Mo, on the other
hand, shows a tendency to accumulate in certain
regions (Figure 8D). These regions with a higher
amount of Mo are visible in backscattering images as
white areas (Figure 8A). As seen in Figure 8D, some
melt pools have a distinctively lower amount of Mo
(bottom left), while other melt pools are richer in
Mo (top right). The dark elongated features in the
backscattering image of Figure 8A are regions of pure Figure 9. Corrosion resistance performance of Ti-6Mn-4Mo. (A) open
Ti. One such region is shown in higher magnification, circuit potential and (B) linear sweep voltammetry.
as shown in Figure 6B. Microstructure in this region Abbreviation: SCE: Saturated calomel electrode.
consists of fine-needle-like plates, and its composition Figure 9B. There is a very small difference in polarization
is pure Ti. Such regions are formed due to insufficient curves of the two conditions. Cathodic branches are in
concentration of alloying elements in a melt pool. the potential range between −1250 mV and −500 mV.
This might be a consequence of inhomogeneous Anodic branches are in the range of −500 – 100 mV.
distributions of Mn and Mo powder particles in the A short plateau of passivity is observed in the range from
mixture. 100 mV to 200 mV. After the plateau, a breakdown starts
3.4. Electrochemical corrosion where current density increases exponentially. Such a
breakdown indicates the formation of pits . The system
[34]
The corrosion resistance performance of Ti-6Mn- stability was evaluated by the value of potential denoted
4Mo under both as-built and heat-treated conditions is as corrosion potential (E ) at the dip of the curve in this
corr
presented in Figure 9 in terms of open circuit potential and figure. Corrosion susceptibility in the corrosion medium
linear sweep voltammetry curves. Open circuit potential is lower when E is higher (or less negative) . The
[42]
corr
decreases first and approaches the minimum value obtained E values are −528.1 ± 8.9 mV and −520.6
corr
between 15 and 20 min for both conditions. Thereafter, ± 10.6 mV for the as-built and heat-treated conditions,
it starts to gradually increase toward a steady state value respectively. Note that the biocompatible Ti alloys
of −225 mV and −230 mV for as-built and heat-treated obtained by conventional manufacturing methods usually
conditions, respectively. The initial decrease in open have higher corrosion resistance in terms of E . However,
corr
circuit potential curve is due to removal of the oxide metallic materials from additive manufacturing processes
formed in air, while the subsequent increase indicates such as PBF and DED processes usually exhibit lower
the formation and growth of a new passive oxide layer . corrosion resistance. For instance, corrosion potentials of
[41]
Tafel potentiodynamic polarization curve is shown in Ti-6Al-4V were reported to be in the wide range of -474
Volume 2 Issue 4 (2023) 7 https://doi.org/10.36922/msam.2180