
Page 85 - MSAM-2-4
P. 85
Materials Science in Additive Manufacturing Laser DED-produced Ti-6Mn-4Mo alloy
mV to −116.2 mV, depending on many factors such as the products of about 60 μm accumulating on sample surface.
selection of process parameters [17,21,22,34,43,44] . The EDS mapping images suggest that these features are
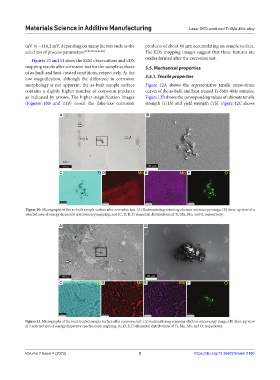
Figures 10 and 11 show the SEM observations and EDS oxides formed after the corrosion test.
mapping results after corrosion test for the sample surfaces 3.5. Mechanical properties
of as-built and heat-treated conditions, respectively. At the
low magnification, although the difference in corrosion 3.5.1. Tensile properties
morphology is not apparent, the as-built sample surface Figure 12A shows the representative tensile stress-strain
contains a slightly higher number of corrosion products curves of the as-built and heat-treated Ti-6Mn-4Mo samples.
as indicated by arrows. The higher-magnification images Figure 12B shows the corresponding values of ultimate tensile
(Figures 10B and 11B) reveal the flake-like corrosion strength (UTS) and yield strength (YS). Figure 12C shows
A B
C D E F
Figure 10. Micrographs of the as-built sample surface after corrosion test. (A) Backscattering scanning electron microscopy image; (B) close-up view of a
selected area of energy dispersive spectroscopy mapping; and (C, D, E, F) elemental distributions of Ti, Mn, Mo, and O, respectively.
A B
C D E F
Figure 11. Micrographs of the heat-treated sample surface after corrosion test. (A) backscattering scanning electron microscopy image; (B) close-up view
of a selected area of energy dispersive spectroscopy mapping; (C, D, E, F) elemental distributions of Ti, Mn, Mo, and O, respectively.
Volume 2 Issue 4 (2023) 8 https://doi.org/10.36922/msam.2180