
Page 55 - MSAM-3-1
P. 55
Materials Science in Additive Manufacturing Adhesion study for multi-material 3D printing
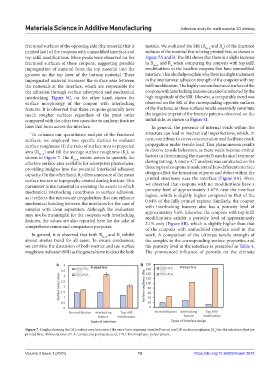
fractured surfaces of the opposing side (the material that is metrics. We evaluated the SRI (R Sa-A and R ) of the fractured
a
printed last) of the coupons with unmodified interface and surfaces of the material that is being printed first, as shown in
top infill modifications. More peaks were observed on the Figure 7A and B. The SRI shows that there is a slight increase
fractured surfaces of these coupons, suggesting possible in R Sa-A and R when comparing the coupons with top infill
a
impregnation of material from the top material into the modifications to the baseline coupons that have unmodified
grooves on the top layer of the bottom material. These interface. This also helps explain why there is a slight increment
impregnated material increases the surface area between in the interlaminar adhesion strength of the coupons with top
the materials at the interface, which are responsible for infill modification. The highly uneven fractured surface of the
the adhesion through surface adsorption and mechanical coupons with interlocking features can also be reflected by the
interlocking. Figure 6C, on the other hand, shows the high magnitude of the SRI. Likewise, a comparable trend was
surface morphology of the coupon with interlocking observed on the SRI of the corresponding opposite surfaces
features. It is observed that these coupons generally have of the fractures, as these surfaces would essentially constitute
much rougher surfaces regardless of the print order the negative imprint of the fracture patterns observed on the
compared with the other two cases due to uniform fracture initial side, as shown in Figure S1.
lines that form across the interface. In general, the presence of internal voids within the
To enhance our quantitative analysis of the fractured structure can lead to mechanical imperfections, which, in
surfaces, we employed two specific metrics to evaluate turn, contribute to stress concentration and facilitate crack
surface roughness: (i) the ratio of surface area to projected propagation under tensile load. This phenomenon results
area (R Sa-A ) and (ii) the average surface roughness (R ), as in diverse tensile behaviors, as these voids become critical
a
shown in Figure 7. The R Sa-A metric serves to quantify the factors in determining the material’s mechanical response
effective surface area available for adsorption phenomena, during testing. A micro-CT analysis was conducted on the
providing insights into the potential interfacial adhesion three types of coupons to understand how different interface
capacity. On the other hand, R offers a measure of the mean designs affect the formation of pores and defect within the
a
surface texture or topography created during fracture. This printed structures near the interface (Figure 8A). Here,
parameter is instrumental in assessing the extent to which we observed that coupons with no modifications have a
mechanical interlocking contributes to surface adhesion, porosity level of approximately 1.47% near the interface
as it reflects the microscale irregularities that can enhance region, which is slightly higher compared to that of the
0.64% of the fully printed regions. Similarly, the coupon
mechanical bonding between the interfaces for the case of with interlocking features also has a porosity level of
samples with clean separation. Although the evaluation approximately 5.6%. Likewise, the coupons with top infill
may not be meaningful for the coupons with interlocking modifications exhibit a porosity level of approximately
features, the values are also reported here for the sake of 2.1% only (Figure 8B), which is slightly higher than that
comprehensiveness and comparison purposes.
of the coupons with unmodified interface used in this
In general, it is observed that both R Sa-A and R exhibit work. A comparison of the ultimate tensile strength of
a
almost similar trend for all cases. To ensure conciseness, the samples to the corresponding surface properties and
we combine the discussion of both metrics and use surface the porosity level at the interface is presented in Table 4.
roughness indicator (SRI) as the general term to describe both The pronounced influence of porosity on the ultimate
A B
Figure 7. Graphs showing the (A) surface area/area ratio (the error bars represent standard error) and (B) surface roughness (R ) for the interfaces that are
a
printed first. Abbreviations: cPLA: conductive polylactic acid; TPU: Thermoplastic polyurethane.
Volume 3 Issue 1 (2024) 10 https://doi.org/10.36922/msam.2672