
Page 56 - MSAM-3-1
P. 56
Materials Science in Additive Manufacturing Adhesion study for multi-material 3D printing
A B
C
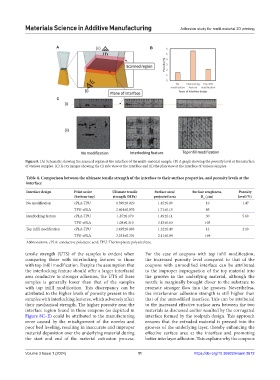
Figure 8. (A) Schematic showing the scanned region at the interface of the multi-material sample. (B) A graph showing the porosity level at the interface
of various samples. (C) X-ray images showing the (i) side view at the interface and (ii) the plan view at the interface of various samples.
Table 4. Comparison between the ultimate tensile strength of the interface to their surface properties, and porosity levels at the
interface
Interface design Print order Ultimate tensile Surface area/ Surface roughness, Porosity
(bottom‑top) strength (MPa) projected area R (µm) level (%)
a
No modification cPLA-TPU 0.399±0.029 1.45±0.09 19 1.47
TPU-cPLA 2.601±0.076 1.71±0.19 45
Interlocking feature cPLA-TPU 1.87±0.170 1.49±0.11 30 5.60
TPU-cPLA 1.08±0.310 3.15±0.63 105
Top infill modification cPLA-TPU 2.495±0.093 1.22±0.49 12 2.10
TPU-cPLA 3.251±0.301 2.11±0.04 164
Abbreviations: cPLA: conductive polylactic acid; TPU: Thermoplastic polyurethane.
tensile strength (UTS) of the samples is evident when For the case of coupons with top infill modification,
comparing those with interlocking features to those the increased porosity level compared to that of the
with top infill modification. Despite the assumption that coupons with unmodified interface can be attributed
the interlocking feature should offer a larger interfacial to the improper impregnation of the top material into
area conducive to stronger adhesion, the UTS of these the grooves in the underlying material, although the
samples is generally lower than that of the samples nozzle is marginally brought closer to the substrate to
with top infill modification. This discrepancy can be promote stronger flow into the grooves. Nevertheless,
attributed to the higher levels of porosity present in the the interlaminar adhesion strength is still higher than
samples with interlocking features, which adversely affect that of the unmodified interface. This can be attributed
their mechanical strength. The higher porosity near the to the increased effective surface area between the two
interface region found in these coupons (as depicted in materials as discussed earlier resulted by the corrugated
Figure 8C–E) could be attributed to the manufacturing interface formed by the toolpath design. This approach
error caused by the misalignment of the nozzles and ensures that the extruded material is pressed into the
poor bed leveling, resulting in inaccurate and improper grooves of the underlying layer, thereby enhancing the
material deposition over the underlying material during effective surface area at the interface and promoting
the start and end of the material extrusion process. better interlayer adhesion. This explains why the coupons
Volume 3 Issue 1 (2024) 11 https://doi.org/10.36922/msam.2672