
Page 54 - MSAM-3-2
P. 54
Materials Science in Additive Manufacturing Heat treatment on bimetallic parts
further delineate the specific transition zone within the the Inconel alloy, containing elements (Cr, Mo, Nb) with a
interface, an EDS line scan analysis was conducted to strong affinity for carbon. After 1 h of heat treatment, the
40
investigate the elemental variations. The EDS line scan size and distribution of precipitates and inclusions diminish
data, as depicted in Figure 5F, reveal that the white bands in comparison to the as-sintered condition. Similarly,
observed in the OM images (Figure 3) and the precipitate the 4-h holding time yields the smallest precipitates and
accumulations (Figure 5A-E) correspond to regions where inclusions relative to the other holding times investigated.
iron (Fe) and Ni constituents undergo interdiffusion in However, an excessively prolonged holding time of 8 h
opposite directions. Within these areas, the concentrations promotes grain growth, resulting in larger precipitate sizes.
of Fe and Ni elements are diminished in comparison to In addition, elongated precipitates are observed in the
their respective pure forms, accompanied by a depletion sample subjected to the 8-h holding time.
of Nb and Mo relative to pure Inconel. Conversely, Cr
exhibits a uniform distribution since both 17-4PH and 3.2. Element diffusion at the interface
IN625 alloys contain this element. The behavior of element diffusion at the interface between
These white bands are characterized by reduced 17-4PH and IN625 is critical for the bonding quality and
porosity, exhibiting either smaller pores or an absence of strength of the bimetallic composite. Previous observations
pores altogether, as evident from Figure 5A-E. The white indicate that a larger distance of alloy diffusion correlates
32,41
band region, dominated by the Fe element, is referred with increased interfacial shear strength. This
to as the Fe-predominant zone. With increasing holding study highlights significant variations in the chemical
time, the thickness of these bands remains relatively compositions of 17-4PH and IN625, particularly in the
unchanged, a phenomenon vividly illustrated in Figure 3. elements Fe, Ni, Mo, and Nb. These variations in elemental
It measures almost 60 μm under both as-sintered and concentrations between two materials initiate diffusion
heat-treated conditions, consistent with our previous during heat treatments, detectable through EDS analysis.
research. Another region is primarily characterized by Ni SEM images and EDS maps illustrating the distribution
39
elements, termed the Ni-predominant zone, as illustrated of Fe and Ni elements near the interface post-annealing at
in Figure 5F. The segregation of precipitates and inclusions varied durations of 1, 4, and 8 h are presented in Figure 6.
within this region undergoes modifications as the holding The primary constituents of the diffusion zone, Fe
time increases. During heat treatment, precipitates form and Ni, exhibit marked variations in their concentrations
during heat treatment as carbon diffuses from steel into within this region. Notably, the concentration of Ni sharply
A B C
D E F
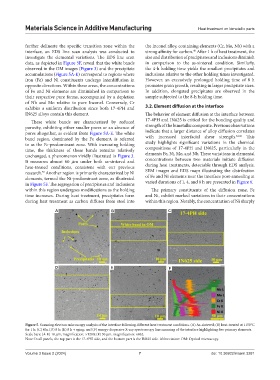
Figure 5. Scanning electron microscopy analysis of the interface following different heat treatment conditions. (A) As-sintered; (B) heat-treated at 1150°C
for 1 h; (C) 4 h; (D) 8 h; (E) 8 h + aging; and (F) energy-dispersive X-ray spectroscopy line scanning of the interface highlighting five primary elements.
Scale bars: (A-E) 10 μm, magnification: ×1280; (F) 50 μm, magnification: ×862.
Note: In all panels, the top part is the 17-4PH side, and the bottom part is the IN625 side. Abbreviation: OM: Optical microscopy.
Volume 3 Issue 2 (2024) 7 doi: 10.36922/msam.3281