
Page 56 - MSAM-3-2
P. 56
Materials Science in Additive Manufacturing Heat treatment on bimetallic parts
A C
B D
E F G H
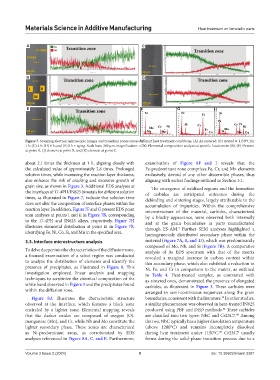
Figure 7. Scanning electron microscopic images and transition zones across different heat treatment conditions. (A) As-sintered; (B) treated at 1150°C for
1 h; (C) 4 h; (D) 8 h; and (E) 8 h + aging. Scale bars: 200 μm, magnification: ×200. Elemental composition analysis at specific locations in (B): (F) Element
at point A, (J) element at point B, and (K) element at point C.
about 2.1 times the thickness at 1 h, aligning closely with examination of Figure 8F and J reveals that the
the calculated value of approximately 2.8 times. Prolonged Fe-predominant zone comprises Fe, Cr, and Mn elements
solution times, while increasing the reaction layer thickness, exclusively, devoid of any other discernible phases, thus
also enhance the risk of cracking and excessive growth of aligning with earlier findings outlined in Section 3.1.
grain size, as shown in Figure 3. Additional EDS analyses at The emergence of oxidized regions and the formation
the interfaces of 17-4PH/IN625 bimetals for different solution of carbides are anticipated outcomes during the
times, as illustrated in Figure 7, indicate that solution time debinding and sintering stages, largely attributable to the
does not alter the composition of interface phases within the accumulation of impurities. Within the comprehensive
reaction layer. In addition, Figure 7F and G present EDS point microstructure of the material, carbides, characterized
scan analyses at points i and ii in Figure 7B, corresponding by a blocky appearance, were observed both internally
to the 17-4PH and IN625 alloys, respectively. Figure 7H and at the grain boundaries in parts manufactured
illustrates elemental distribution at point iii in Figure 7B, through ES-AM. Further SEM analyses highlighted a
4
identifying Fe, Ni, Co, Si, and Mn in the specified area. homogeneously distributed secondary phase within the
3.3. Interface microstructure analysis material (Figure 7A, B, and D), which was predominantly
composed of Mo, Nb, and Si (Figure 7B). A comparative
To delve deeper into the characteristics of the diffusion zone, analysis of its EDS spectrum with that of the matrix
a focused examination of a select region was conducted revealed a marginal increase in carbon content within
to analyze the distribution of elements and identify the this secondary phase, which also exhibited a reduction in
presence of precipitates, as illustrated in Figure 8. This Ni, Fe, and Cr in comparison to the matrix, as outlined
investigation employed linear analysis and mapping in Table 4. Heat-treated samples, as contrasted with
techniques to scrutinize the chemical composition of the as-sintered ones, demonstrated the presence of elongated
white band observed in Figure 3 and the precipitates found carbides, as illustrated in Figure 3. These carbides were
within the diffusion zone. arranged in semi-continuous sequences along the grain
Figure 8A illustrates the characteristic structure boundaries, consistent with the literature. In other studies,
35
observed at the interface, which features a black zone a similar phenomenon was observed in heat-treated IN625
encircled by a lighter zone. Elemental mapping reveals produced using PBF and DED methods. These carbides
44
that the darker oxides are composed of oxygen (O), are classified into two types: NbC and Cr23C7. Among
45
manganese (Mn), and Cr, while Nb and Mo constitute the the two, NbC typically has a higher dissolution temperature
lighter secondary phase. These zones are characterized (above 1200°C) and remains incompletely dissolved
29
as Ni-predominant areas, as corroborated by EDS during heat treatment under 1150°C. Cr23C7 usually
analyses referenced in Figure 8A, C, and E. Furthermore, forms during the solid-phase transition process due to a
Volume 3 Issue 2 (2024) 9 doi: 10.36922/msam.3281