
Page 59 - MSAM-3-2
P. 59
Materials Science in Additive Manufacturing Heat treatment on bimetallic parts
A B
C D
E
F
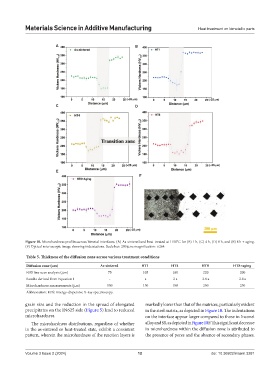
Figure 10. Microhardness profiles across bimetal interfaces. (A) As-sintered and heat-treated at 1150°C for (B) 1 h, (C) 4 h, (D) 8 h, and (E) 8 h + aging.
(F) Optical microscopic image showing indentations. Scale bar: 200 μm; magnification: ×264.
Table 5. Thickness of the diffusion zone across various treatment conditions
Diffusion zone (μm) As‑sintered HT1 HT4 HT8 HT8+aging
EDS line scan analysis (μm) 75 105 160 220 200
Results derived from Equation I - a 2 a 2.8 a 2.8 a
Microhardness measurements (μm) 100 150 188 250 250
Abbreviation: EDS: Energy-dispersive X-ray spectroscopy.
grain size and the reduction in the spread of elongated markedly lower than that of the matrices, particularly evident
precipitates on the IN625 side (Figure 5) lead to reduced in the steel matrix, as depicted in Figure 10. The indentations
microhardness. on the interface appear larger compared to those in Inconel
The microhardness distributions, regardless of whether alloy and SS, as depicted in Figure 10F. This significant decrease
in the as-sintered or heat-treated state, exhibit a consistent in microhardness within the diffusion zone is attributed to
pattern, wherein the microhardness of the reaction layers is the presence of pores and the absence of secondary phases.
Volume 3 Issue 2 (2024) 12 doi: 10.36922/msam.3281