
Page 55 - MSAM-3-2
P. 55
Materials Science in Additive Manufacturing Heat treatment on bimetallic parts
A
B
C
D
E
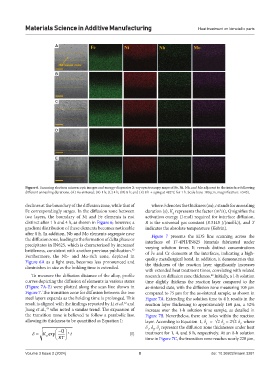
Figure 6. Scanning electron microscopic images and energy-dispersive X-ray spectroscopy maps of Fe, Ni, Nb, and Mo adjacent to the interface following
different annealing durations. (A) As-sintered; (B) 1 h; (C) 4 h; (D) 8 h; and (E) 8 h + aging at 482°C for 1 h. Scale bars: 100 μm, magnification: ×543).
declines at the boundary of the diffusion zone, while that of where δ denotes the thickness (m), t stands for annealing
Fe correspondingly surges. In the diffusion zone between duration (s), K represents the factor (m /s), Q signifies the
2
0
two layers, the boundary of Ni and Fe elements is not activation energy (J∙mol) required for interface diffusion,
distinct after 1 h and 4 h, as shown in Figure 6; however, a R is the universal gas constant (8.3145 J/(mol∙k)), and T
gradient distribution of these elements becomes noticeable indicates the absolute temperature (Kelvin).
after 8 h. In addition, Nb and Mo elements segregate near Figure 7 presents the EDS line scanning across the
the diffusion zone, leading to the formation of delta phase or interfaces of 17-4PH/IN625 bimetals fabricated under
precipitates in IN625, which is characterized by increased varying solution times. It reveals distinct concentrations
brittleness, consistent with another previous publication. of Fe and Cr elements at the interfaces, indicating a high-
42
Furthermore, the Nb- and Mo-rich zone, depicted in quality metallurgical bond. In addition, it demonstrates that
Figure 6A as a light area, becomes less pronounced and the thickness of the reaction layer significantly increases
diminishes in size as the holding time is extended.
with extended heat treatment times, correlating with related
To measure the diffusion distance of the alloy, profile research on diffusion zone thickness. Initially, a 1-h solution
43
curves depicting the diffusion of elements in various states time slightly thickens the reaction layer compared to the
(Figure 7A-E) were plotted along the scan line shown in as-sintered state, with the diffusion zone measuring 105 μm
Figure 7. The transition zone for diffusion between the two compared to 75 μm for the as-sintered sample, as shown in
steel layers expands as the holding time is prolonged. This Figure 7A. Extending the solution time to 4 h results in the
result is aligned with the findings reported by Li et al. and reaction layer thickening to approximately 160 μm, a 52%
32
Jiang et al., who noted a similar trend. The expansion of increase over the 1-h solution time sample, as detailed in
43
the transition zone is believed to follow a parabolic law, Figure 7B. Nevertheless, there are holes within the reaction
allowing its thickness to be quantified as Equation I: layer. According to Equation I, δ = √2 δ = 2√2 δ , where
2
3
1
δ , δ , δ represent the diffusion zone thicknesses under heat
Q 1 2 3
K exp t * (I) treatment for 1, 4, and 8 h, respectively. At an 8-h solution
0
RT time in Figure 7C, the transition zone reaches nearly 220 μm,
Volume 3 Issue 2 (2024) 8 doi: 10.36922/msam.3281