
Page 10 - MSAM-3-3
P. 10
Materials Science in Additive Manufacturing Multi-material Ti6Al4V-B4C through L-DED
Microhardness was measured using a Phase II Plus location on either side of the cylinder (Figure 2A). The
Micro Vickers Hardness Tester (Phase II Plus, USA). The Ti64-B4C samples exhibited reduced porosity at the
hardness indents were made in the side cross-section for borders of the melt pool (Figure 3A). The RC samples
all samples with a load of 200 g and a dwell time of 15 s. displayed significant porosity concentrated in the Ti64
For the monolithic samples, indents were made along core of the composite and at the interface (Figure 5). In
the center of the sample, progressing upward in the build addition, cracks were observed in the multi-material
direction, with 10 points recorded. A grid pattern was structure at the external portion of section A-A of the
applied on the RC cylinder, starting from the outer edge of cylinder. Notably, our observation indicates that the B4C
the sample and moving toward the center in a 5 × 5.5 mm particles tend to float to the surface of the melt pool in
grid, with data points collected at approximately 0.5 mm the Ti64-B4C cylinders, consistent with their location
intervals, while avoiding the B4C particles. within the structure (Figure 3A). This is also observed for
the Ti64-B4C shell of the RC samples (Figure 5). It would
3. Results appear that particle impregnation occurred as there is
It was hypothesized that a multi-material structure an observable reaction zone interface between the B4C
comprising a Ti64 core and Ti64-B4C shell would exhibit particles and the Ti64 matrix (Figure 6D). Diffusion of the
synergistic compression behavior by outperforming particle’s constituents into the Ti64 matrix is evident from
monolithic structures. In the current study, DED the change in the microstructure of the matrix, resembling
samples of Ti64 and Ti64-B4C were produced, and acicular α-Ti, and also in the newly formed needle phase
characterization was conducted through optical imaging near the reaction zone of the particles (e.g., clusters
of the microstructure evolution, XRD of the control and throughout the matrix) (Figure 6). With EDS mapping
treated samples for phase analysis, Vickers microhardness, (Figure 6B), the Ti64 matrix displays minimal changes in
and compression testing of cylindrical structures. the matrix to Ti, Al, and V at the interface between the
first annular ring and the core of the RC structures. The
3.1. Microstructure and phase analysis size of the α-Ti grains changes between Ti64 and Ti64-B4C
Optical imaging of the microstructure for the control because adding B4C particles no longer forms the acicular
and two treated samples revealed varying porosity; Ti64- gains of α-Ti. The AGI of the Ti64 samples using a 10 µm
B4C exhibited the least porosity, while the RC sample line is 1.2, while that of the Ti64-B4C samples is 0.5.
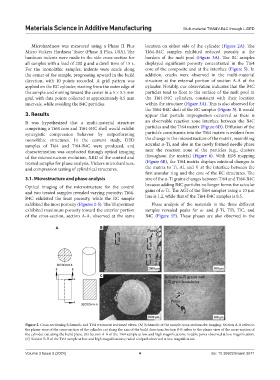
exhibited the most porosity (Figures 2-5). The Ti specimen Phase analysis of the materials in the three different
exhibited maximum porosity toward the exterior portion samples revealed peaks for α- and β-Ti, TiB, TiC, and
of the cross-section, section A-A, observed at the same B4C (Figure 5F). These phases are also observed in the
A B
C
Figure 2. Cross-sectioning Schematic and Ti64 treatment sectioned views. (A) Schematic of the sample cross-sections for imaging: Section A-A refers to
the planer view of the cross-section of the cylinder cut along the axis of the build direction; Section B-B refers to the planer view of the cross-section of
the cylinder cut along the build plane. (B) Section A-A of the Ti64 sample at low and high magnifications; notable pores observed at low magnification.
(C) Section B-B of the Ti64 sample at low and high magnifications; radial toolpath observed at low magnification.
Volume 3 Issue 3 (2024) 4 doi: 10.36922/msam.3571