
Page 12 - MSAM-3-3
P. 12
Materials Science in Additive Manufacturing Multi-material Ti6Al4V-B4C through L-DED
A the cylinders (Figure 7A). The different levels of ceramics
are also reflected in the difference in the hardness of the
matrix, with the exterior of the cylinder exhibiting higher
hardness compared to the core (Figure 8). These changes
in the microstructure display the bonding between the
Ti64 matrix and the B4C particles. This leads to a large
increase in the wear resistance of the treated samples.
B C Figure 7C-E refers to one of the cemented carbide-cutting
inserts used for the turned surfaces of the Ti64 cylinder
and treated samples. The cutting inserts used for the Ti64
cylinders did not exhibit signs of wear. In Figure 7C,
the turned surface displays an even spacing between
each spiral, demonstrating the machinability of Ti64
in Figure 7D. The surface of the Ti64-B4C in Figure 7E
displays the lack of machinability with the addition of the
D E
B4C particles. These B4C particles can still be seen on the
surface of the treated cylinders after turning, and there
are marks left on the cylinder’s surface from being ground
between the surfaces of the inserts and the cylinder.
3.2. Compression and microhardness testing
The study aimed to assess whether radial multi-material
F structures, manufactured using DED-based metal AM,
would exhibit enhanced compressive strength compared
to monolithic components. All samples were printed in
the same radial pattern (i.e., concentric circles) to ensure
consistency in strength without variations due to different
infill patterns. The control Ti6Al4V cylinders exhibited a
YS of 972 ± 17 MPa. The first treated sample, Ti64-B4C
cylinders, exhibited a YS of 1440 ± 68 MPa. The second
treated sample and our primary focus, RC cylinders,
exhibited a YS of 1422 ± 21 MPa. The elastic modulus
of Ti64, Ti64-B4C, and RC cylinders was 110 ± 8, 107 ±
3, and 114 ± 1 GPa, respectively (Figure 8). The samples
reached the failure point during compression testing, and
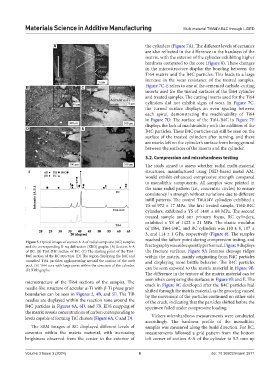
Figure 5. Optical images of section A-A of radial composite (RC) samples
and the corresponding X-ray diffraction (XRD) graphs. (A) Section A-A fractography was subsequently performed. Figure 9 displays
of RC. (B) Ti64-B4C section of RC. (C) The starting point of the Ti64- the fracture surfaces. Figure 9A features cleavage ridges
B4C section of the RC structure. (D) The region displaying the B4C and within the matrix, mainly originating from B4C particles
unmelted Ti64 particles agglomerating around the surface of the melt and displaying more brittle behavior. The B4C particles
pool. (E) Ti64 core with large pores within the structure of the cylinder. can be seen exposed to the matrix material in Figure 9B.
(F) XRD graphs.
The difference in the texture of the matrix material can be
seen when comparing the surfaces in Figure 9B and E. The
microstructure of the Ti64 sections of the samples. The crack in Figure 9C developed after the B4C particles had
needle-like structure of acicular α-Ti with β-Ti phase grain shifted through the matrix material, as the grooving caused
boundaries can be seen in Figures 2, 4B, and 5E. The TiB by the movement of the particles continued on either side
needles are displayed within the reaction zone around the of the crack, indicating that the particles shifted before the
B4C particles in Figures 6A, 6D, and 7B. EDS mapping of specimen failed under compressive loading.
the matrix reveals concentrations of carbon corresponding to
levels capable of forming TiC clusters (Figure 6A, C and D). Vickers microhardness measurements were conducted
accordingly. The hardness profile of the monolithic
The SEM images of RC displayed different levels of samples was measured along the build direction. For RC,
ceramics within the matrix material, with increasing measurements followed a grid pattern from the bottom
brightness observed from the center to the exterior of left corner of section A-A of the cylinder to 5.5 mm up
Volume 3 Issue 3 (2024) 6 doi: 10.36922/msam.3571