
Page 113 - MSAM-3-4
P. 113
Materials Science in Additive Manufacturing Bistable 3D-printed compliant structure
A B
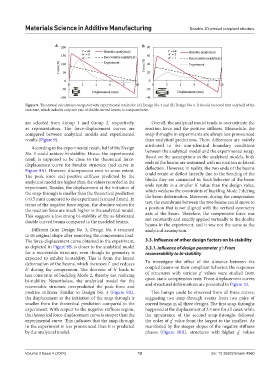
Figure 9. Theoretical calculations compared with experimental results for (A) Design No. 3 and (B) Design No. 6. It should be noted that only half of the
structure, which includes only one pair of double curved beams, is compared here.
are selected from Group 1 and Group 2, respectively, Overall, the analytical model tends to overestimate the
as representatives. The force-displacement curves are reaction force and the positive stiffness. Meanwhile, the
compared between analytical models and experimental snap-throughs in experiments are always less pronounced
results (Figure 9). than analytical predictions. These differences are mainly
attributed to the non-identical boundary conditions
According to the experimental result, half of the Design
No. 3 could achieve bi-stability. Hence, the experimental between the analytical model and the experimental setup.
Based on the assumptions in the analytical models, both
result is supposed to be close to the theoretical force- ends of the beams are restrained with no rotation or lateral
displacement curve for bistable structure (red curve in
Figure 9A). However, discrepancies exist to some extent. deflection. However, in reality, the two ends of the beams
The peak force and positive stiffness predicted by the could rotate or deflect laterally due to the bending of the
analytical model are higher than the values recorded in the blocks they are connected to. Such behavior of the beam
experiment. Besides, the displacement at the initiation of ends results in a smaller h’ value than the design value,
the snap-through is smaller than the theoretical prediction which weakens the constraints of buckling Mode 2 during
(<0.5 mm) compared to the experiment (around 2 mm). In the beam deformation. Moreover, during the compression
terms of the negative force region, the absolute values for test, the membrane between the two beams could move to
the reaction force are much higher in the analytical model. a position that is not aligned with the vertical symmetry
This suggests a less strong bi-stability of the as-fabricated axis of the beam. Therefore, the compressive force was
double curved beams compared to the modeled beams. not constantly and exactly applied vertically to the double
beams in the experiment, and it was not the same as the
Different from Design No. 3, Design No. 6 returned analytical assumption.
to its original shape after removing the compression load.
The force-displacement curve obtained in the experiment, 3.3. Influence of other design factors on bi-stability
as depicted in Figure 9B, is closer to the analytical model 3.3.1. Influence of design parameter g’: From
for a recoverable structure, even though its geometry is recoverability to bi-stability
expected to exhibit bi-stability. This is from the lateral
deformation of the beams, which increases l’ and reduces To investigate the effect of the distance between the
h’ during the compression. The decrease of h’ leads to coupled beams on their compliant behavior, the responses
less constraint of buckling Mode 2, thereby not realizing of structures with various g’ values were studied from
bi-stability. Nevertheless, the analytical model for the quasi-static compression tests. Force-displacement curves
recoverable structure overpredicted the peak force and and structural deformations are presented in Figure 10.
positive stiffness. Similar to Design No. 3 (Figure 9A), Two humps could be observed from all three curves,
the displacement at the initiation of the snap-through is suggesting two snap-through events from two pairs of
smaller from the theoretical prediction compared to the curved beams in all three designs. The first snap-throughs
experiment. With respect to the negative stiffness region, happened at the displacement of 2.5 mm for all cases, while
the theoretical force-displacement curve is steeper than the the appearance of the second snap-throughs followed
experimental curve. This indicates that the snap-through the order of g’ value from the largest to the smallest. As
in the experiment is less pronounced than it is predicted manifested by the steeper slopes of the negative stiffness
by the analytical model. phases (Figure 10A), structures with higher g’ values
Volume 3 Issue 4 (2024) 12 doi: 10.36922/msam.4960