
Page 109 - MSAM-3-4
P. 109
Materials Science in Additive Manufacturing Bistable 3D-printed compliant structure
Group 2 exhibited high reversibility after removing the This observation is consistent with the findings that an
compressive loading. The structures with higher h’, yielding even higher h’ value is required to achieve bi-stability for
stronger snap-through can undergo more considerable a double curved-beam system configured as the proposed
deformation while still maintaining their ability to return structure. 25
to the initial configurations.
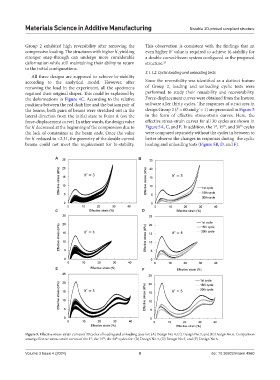
3.1.1.2. Cyclic loading and unloading tests
All three designs are supposed to achieve bi-stability
according to the analytical model. However, after Since the reversibility was identified as a distinct feature
removing the load in the experiment, all the specimens of Group 2, loading and unloading cyclic tests were
regained their original shapes. This could be explained by performed to study their reusability and recoverability.
the deformations in Figure 4C. According to the relative Force-displacement curves were obtained from the Instron
positions between the red dash line and the bottom pair of software after thirty cycles. The responses of structures in
the beams, both pairs of beams were stretched out in the design Group 2 (l’ = 60 and g’ = 1) are presented in Figure 5
lateral direction from the initial state to Point A (on the in the form of effective stress-strain curves. Here, the
force-displacement curve). In other words, the design value effective stress-strain curves for all 30 cycles are shown in
st
for h’ decreased at the beginning of the compression due to Figure 5A, C, and E. In addition, the 1 , 15 , and 30 cycles
th
th
the lack of constraints at the beam ends. Once the value were compared separately without the cycles in between to
for h’ reduced to <2.31, the geometry of the double curved better observe the changes in responses during the cyclic
beams could not meet the requirement for bi-stability. loading and unloading tests (Figure 5B, D, and F).
A B
C D
E F
Figure 5. Effective stress-strain curves of 30 cycles of loading and unloading tests for: (A) Design No. 4, (C) Design No. 5, and (E) Design No. 6. Comparison
among effective stress-strain curves of the 1 , the 15 , the 30 cycles for: (B) Design No.4, (D) Design No.5, and (F) Design No.6.
st
th
th
Volume 3 Issue 4 (2024) 8 doi: 10.36922/msam.4960