
Page 107 - MSAM-3-4
P. 107
Materials Science in Additive Manufacturing Bistable 3D-printed compliant structure
3π 4 h ∆ 3 1 4 3 1 4 The relationship between the normalized force and
2 ’
∆
F = ∆ − + − 2 −− − 2 displacement of a bistable curved beam is expressed as:
1
2 2 4 h 3 ’ 2 4 h 3 ’
2 4
218π ∆
.
F = 4.118π − . ,h > ’ 1 67 3π 4 h ∆ 3 1 4 3 1 4
2 ’
2
4 4 ∆ −+ − 2 ’ ∆ −− − 2 ’ ,
231
F 3 = 8π − 6π ∆ ,’h > . F = 2 2 4 h 3 2 4 h 3
∆ < porr∆ > p 418π 2 −2 18π 4 ∆, p ≤ ∆ ≤ p
.
.
l r l r
(VII)
(V)
It should be noted that higher-order deformations were
where F , F , and F are the normalized applied force
2
1
3
for the first three buckling modes, and ∆ is the normalized ignored here. The analytical models were used to compare
the experimental results and understand the mechanisms
vertical displacement.
behind the response of the proposed structures under
From Equation V, the force F is related to the compression.
1
displacement ∆ as a cubic function for a given design
parameter h’, while F and F are the linear functions of ∆ 3. Results and discussion
2
3
and are independent of h’. According to the mechanisms 3.1. Influence of design parameter h’ on negative
behind reversible curved-beam (Figure 1B), the force- stiffness phase
displacement curve is determined by the functions F
1
and F in Equation V. With respect to the bistable beam, 3.1.1. Recoverability of structures in Group 2
2
the force-displacement relationship is determined by the (l’ = 60, g’ = 1)
functions F and F in Equation V. Take bistable curved 3.1.1.1. Quasi-static compression tests and FE simulations
3
1
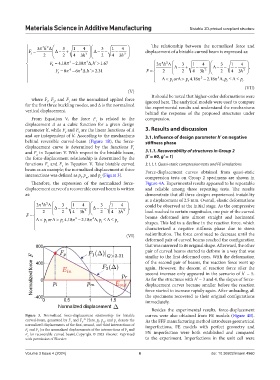
beam as an example; the normalized displacement at three Force-displacement curves obtained from quasi-static
intersections was defined as p, p , and p (Figure 3).
l m r compression tests on Group 2 specimens are shown in
Therefore, the expression of the normalized force- Figure 4A. Experimental results appeared to be repeatable
displacement curve of a recoverable curved beam is written and reliable among three repeating tests. The results
as: demonstrate that all three designs experienced instability
at a displacement of 2.5 mm. Overall, elastic deformations
3π 4 h ∆ 3 1 4 3 1 4
2 ’
∆ −+ − ∆ −− − , could be observed at the initial stage. As the compressive
2 2 4 h 3 2 ’ 2 4 h 3 2 ’ load reached to certain magnitudes, one pair of the curved
F = beams deformed into almost straight and horizontal
∆ < porr ∆ > p 418. π 2 −2 18. π 4 ∆, p ≤ ∆ ≤ p r
l
l
r
shapes. This led to a decline in the reaction force, which
characterized a negative stiffness phase due to stress
(VI) redistribution. The force continued to decrease until the
deformed pair of curved beams reached the configuration
that was mirrored to its original shape. Afterward, the other
pair of curved beams started to deform in a way that was
similar to the first deformed ones. With the deformation
of the second pair of beams, the reaction force went up
again. However, the descent of reaction force after the
second increase only appeared in the scenario of h’ = 5.
As for the structures with h’ = 3 and 4, the slopes of force-
displacement curves became smaller before the reaction
force started to increase rapidly again. After unloading, all
the specimens recovered to their original configurations
immediately.
Besides the experimental results, force-displacement
Figure 3. Normalized force-displacement relationship for bistable curves were also obtained from FE models (Figure 4B).
curved-beam, generated by F and F . Here, p, p , and p denote the As the FFF manufacturing method introduces geometrical
31
m
l
1
r
3
normalized displacements of the first, second, and third intersections of imperfections, FE models with perfect geometry and
F and F (or the normalized displacements of the intersections of F and
1
1
3
F for recoverable curved beam).Copyright © 2023 Elsevier. Reprinted 5% imperfection were both established and compared
2
with permission of Elsevier. to the experiment. Imperfections in the unit cell were
Volume 3 Issue 4 (2024) 6 doi: 10.36922/msam.4960