
Page 110 - MSAM-3-4
P. 110
Materials Science in Additive Manufacturing Bistable 3D-printed compliant structure
As indicated above, noticeable differences could be 3.1.2. Partial bi-stability of structures in Group 1
identified between the effective stress-strain curves for (l’ = 30, g’ = 1)
the 1 cycle and all the rest cycles. The area between the Responses of the structures in Group 1 under quasi-static
st
loading and unloading curve indicates the dissipated compression tests were captured under two conditions,
energy by the structure within one cycle. It could that is, only the bottom surface taped to the compression
41
be observed from Figure 5B, D, and F, for all three plate and both top and bottom surfaces taped to the
structures, the area from the 1 cycle is much larger than compression plates.
st
those from the 15 and 30 cycles. It could be deduced
th
th
that the energy dissipation mostly happened within Figure 7A depicts the force-displacement curves of the
the 1 loading and unloading cycle. Furthermore, the three structures in Group 1. The experiments with only the
st
structures dissipated a smaller but similar amount of bottom surface glued to the compression plate were carried
energy during later cycles. out first. The shaded areas suggested minor discrepancies
in experimental results among the three repeating tests for
The critical buckling stress during the loading phase each design. Some features of the snap-through among the
and the residual strain after the unloading phase are three different designs shared a similar phenomenon as in
plotted in Figure 6. The critical buckling stress for all Group 2. To be specific, the structural stiffness was observed
three structures drops drastically after the 1 cycle, to increase with greater h’ values, leading to higher critical
st
whereas slight differences are observed for cycles force (P ). Besides, all three designs experienced the first
cr
afterward. Convergence of critical effective stress appears snap-through at approximately the same displacement.
after the 6 cycle for all three structures at the effective No obvious second snap-through could be observed from
th
stress of 2.5 kPa, 5.8 kPa, and 8.5 kPa, respectively. The the design with h’ = 3. With the increase of h’, the second
early convergence of critical effective stress indicates that snap-through appeared to be more pronounced. During
the plastic deformation mainly happened during the first the experiment, there was a phase in which no force was
few cycles. The residual strains for all three structures recorded in the Instron machine for all three designs. Since
are below 3%, suggesting their remarkable recoverability the loading cell of this Instron machine is connected to the
and reusability. The precision of the Instron machine top compression plate, the zero-force phase indicates the
could cause the fluctuation of the residual strains. detachment of the top surface of the structure and the
Overall, structures in Group 2 are robust against repeated top compression plate. After removing the compressive
loadings. load, one pair of the curved beams recovered to its initial
The comparison among the three structures implies configuration, and the other pair remained in its deformed
that Design No. 6 (l’ = 60, h’ = 5) yields a slightly more shape.
resilient response toward loading and unloading cycles. To investigate the causes of the occurrence of the zero-
To be specific, the residual strain for Design No. 6 is force phase, another group of experiments were performed
smaller than Designs No. 4 (l’ = 60, h’ = 3) and No. 5 with both the bottom and top surfaces of the specimens
(l’ = 60, h’ = 4). This observation suggests that Design glued to the compression plates. The dished lines in
No. 6 experienced the least amount of plastic deformation Figure 7A are the force-displacement curves, which are
among all. In terms of critical effective stress, all three aligned with the previous results without the top surface
structures witnessed an approximately 60% decrease attached to the plate. In this case, negative forces were
mainly from the 1 cycle. recorded during the zero-force phase in the previous tests,
st
A B
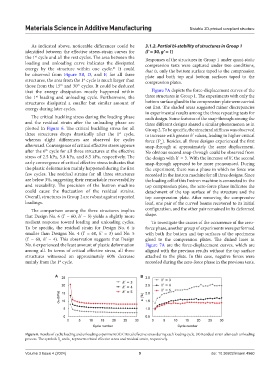
Figure 6. Results of cyclic loading and unloading experiment (A) Critical effective stress during each loading cycle. (B) Residual strain after each unloading
process. The symbols δ and ε represent critical effective stress and residual strain, respectively.
cr
r
Volume 3 Issue 4 (2024) 9 doi: 10.36922/msam.4960