
Page 108 - MSAM-3-4
P. 108
Materials Science in Additive Manufacturing Bistable 3D-printed compliant structure
A B
C
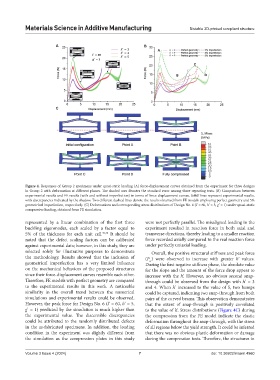
Figure 4. Responses of Group 2 specimens under quasi-static loading (A) force-displacement curves obtained from the experiment for three designs
in Group 2 with deformation at different phases. The shaded area denotes the standard error among three repeating tests. (B) Comparison between
experimental results and FE results (with and without imperfection) in terms of force-displacement curves. Solid lines represent experimental results,
with discrepancies indicated by the shadow. Two different dashed lines denote the results obtained from FE models employing perfect geometry and 5%
geometrical imperfection, respectively. (C) Deformations and corresponding stress distributions of Design No. 6 (l’ = 60, h’ = 5, g’ = 1) under quasi-static
compressive loading, obtained from FE simulation.
represented by a linear combination of the first three were not perfectly parallel. The misaligned loading in the
buckling eigenmodes, each scaled by a factor equal to experiment resulted in reaction force in both axial and
5% of the thickness for each unit cell. 39,40 It should be transverse directions, thereby leading to a smaller reaction
noted that the defect scaling factors can be calibrated force recorded axially compared to the real reaction force
against experimental data; however, in this study, they are under perfectly uniaxial loading.
selected solely for illustrative purposes to demonstrate Overall, the positive structural stiffness and peak force
the methodology. Results showed that the inclusion of (P ) were observed to increase with greater h’ values.
cr
geometrical imperfection has a very limited influence During the first negative stiffness phase, the absolute value
on the mechanical behaviors of the proposed structures for the slope and the amount of the force drop appear to
since their force-displacement curves resemble each other. increase with the h’. However, no obvious second snap-
Therefore, FE models with perfect geometry are compared through could be observed from the design with h’ = 3
to the experimental results in this work. A noticeable and 4. When h’ increased to the value of 5, two humps
similarity in the overall trend between the numerical could be captured, indicating two snap-through from both
simulations and experimental results could be observed. pairs of the curved beams. This observation demonstrates
However, the peak force for Design No. 6 (l’ = 60, h’ = 5, that the extent of snap-through is positively correlated
g’ = 1) predicted by the simulation is much higher than to the value of h’. Stress distributions (Figure 4C) during
the experimental value. The discernible discrepancies the compression from the FE model indicate the elastic
could be attributed to the randomly distributed defects deformation throughout the snap-through, with the stress
in the as-fabricated specimens. In addition, the loading of all regions below the yield strength. It could be inferred
condition in the experiment was slightly different from that there was no obvious plastic deformation or damage
the simulation as the compression plates in this study during the compression tests. Therefore, the structures in
Volume 3 Issue 4 (2024) 7 doi: 10.36922/msam.4960