
Page 112 - MSAM-3-4
P. 112
Materials Science in Additive Manufacturing Bistable 3D-printed compliant structure
The defects in the as-fabricated specimens due to the FFF stiffness of the beam is inversely proportional to its
printing, as well as the misaligned compression plates, could length. Therefore, the wider span l’ of Group 2 leads to
be the reasons for this discrepancy. Moreover, the deformation its smaller stiffness and lower maximum effective stress
(Figure 8A) of the curved beams during experiments was not compared to Group 1. In addition, structures with smaller
captured the same as shown in simulations, which could be l’ experienced more pronounced snap-throughs compared
attributed to the undesired boundary conditions. to those with larger l’. For instance, steeper slopes for the
negative stiffness phases could be observed in Group 1. In
3.2. Influence of design parameter l’: From addition, no obvious second snap-through was observed
recoverability to partial bi-stability in structures with l’ = 60 in Figure 8C, while it appeared in
3.2.1. Experimental results comparison between the corresponding structures from Group 1 (l’ = 30).
Group 1 and Group 2 The more pronounced snap-through led to the
To study the influence of l’ on structural response subjected transition from a non-bistable to a half-bistable mechanism
to quasi-static compressive loading, Figure 8 compares the within the structures. Given that the dimensions of the
effective stress-strain curves between the structures with side walls are the same for both Group 1 and Group 2, the
the same h’ and g’ design values from Group 1 and Group 2. decrease of l’ strengthened the restraining effect from the
side walls on the double curved beams. The more lateral
The stiffness of a beam is generally influenced by
its length, material properties, and its cross-sectional constraints ensure less sacrifice of h’, allowing the beam to
exhibit bi-stability.
configuration:
Fl 3 3.2.2. Theoretical calculations based on analytical
∆= (VIII) model
kEI
Here, the analytical models were employed to calculate the
Where k is the coefficient for different boundary feature properties of the proposed compliant structures
conditions of a beam, for a given cross-section, the as described in Section 2.4. Designs No. 3 and No. 6
A B
C
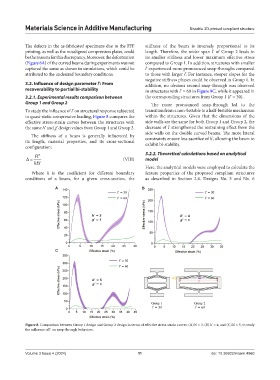
Figure 8. Comparison between Group 1 design and Group 2 design in terms of effective stress-strain curves: (A) h’ = 3; (B) h’ = 4; and (C) h’ = 5, to study
the influence of l’ on snap-through behaviors.
Volume 3 Issue 4 (2024) 11 doi: 10.36922/msam.4960