
Page 111 - MSAM-3-4
P. 111
Materials Science in Additive Manufacturing Bistable 3D-printed compliant structure
A B
C
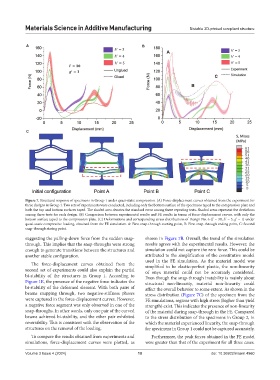
Figure 7. Structural response of specimens in Group 1 under quasi-static compression. (A) Force-displacement curves obtained from the experiment for
three designs in Group 1. Two sets of experiments were conducted, including only the bottom surface of the specimens taped to the compression plate and
both the top and bottom surfaces taped. The shaded area denotes the standard error among three repeating tests. Shaded areas represent the deviations
among three tests for each design. (B) Comparison between experimental results and FE results in terms of force-displacement curves, with only the
bottom surface taped to the compression plate. (C) Deformations and corresponding stress distributions of Design No. 6 (l’ = 30, h’ = 5, g’ = 1) under
quasi-static compressive loading, obtained from the FE simulation. A: First snap-through starting point, B: First snap-through ending point, C: Second
snap-through staring point.
suggesting the pulling-down force from the sudden snap- shown in Figure 7B. Overall, the trend of the simulation
through. This implies that the snap-throughs were strong results agrees with the experimental results. However, the
enough to generate transitions between the structures and simulation could not capture the zero force. This could be
another stable configuration. attributed to the simplification of the constitutive model
used in the FE simulation. As the material model was
The force-displacement curves obtained from the simplified to be elastic-perfect plastic, the non-linearity
second set of experiments could also explain the partial of onyx material could not be accurately considered.
bi-stability of the structures in Group 1. According to Even though the snap-through instability is mainly about
Figure 1E, the presence of the negative force indicates the structural non-linearity, material non-linearity could
bi-stability of the deformed element. With both pairs of affect the overall behavior to some extent. As shown in the
beams snapping through, two negative-stiffness phases stress distribution (Figure 7C) of the specimen from the
were captured in the force-displacement curves. However, FE simulations, regions with high stress (higher than yield
a negative force segment was only observed in one of the strength) exist. This indicates the presence of non-linearity
snap-throughs. In other words, only one pair of the curved of the material during snap-through in the FE. Compared
beams achieved bi-stability, and the other pair exhibited to the stress distribution of the specimens in Group 2, in
reversibility. This is consistent with the observation of the which the material experienced linearity, the snap-through
structures on the removal of the loading. for specimens in Group 1 could not be captured accurately.
To compare the results obtained from experiments and Furthermore, the peak forces obtained in the FE model
simulations, force-displacement curves were plotted, as were greater than that of the experiment for all three cases.
Volume 3 Issue 4 (2024) 10 doi: 10.36922/msam.4960