
Page 35 - MSAM-3-4
P. 35
Materials Science in Additive Manufacturing Gyroid non-pneumatic tires through additive manufacturing
generated using the solid wheel as the bounding geometric published literature. The compression testing was
body. Three separate TPMS designs were created with performed in accordance with the ASTM D695 standard
varying sheet thicknesses. Table 1 shows design properties for compressive testing of rigid polymer tensile bars and
for different tire designs. Tire 1 had a constant sheet rigid cellular polymers. Force and displacement were
51
thickness of 1.0 mm, while Tire 2 and Tire 3 had radially recorded by the load frame.
ramped wall thickness, increasing linearly to 1.5 mm and To accurately measure the deformation of each TPMS
2.0 mm, respectively. This choice of thicknesses was used to layer, we utilized the VIC-3D DIC system (Correlated
keep volume fractions low while allowing for comparison Solutions, USA). Each tire was speckled with a pattern of
between the performance of constant and ramped lattices. white dots, which were captured by the DIC cameras during
The TPMS unit cell (UC) measured 5 mm in height by compression testing. Using VIC-3D post-processing
10 mm in the radial direction, repeated 16 times around the software, these speckles were individually tracked. The
central axis. Once the TPMS lattices were generated, they positions of the top and bottom points of each layer were
were added between the hub and the tread to complete the recorded, allowing for the calculation of the layer thickness
tire design. This operation ensured that the rims remained at any given time. Changes in layer thickness were used to
solid, and the TPMS lattice filled the regions between the determine the deformation of the layer. Local deformation
two while forming one part, resulting in a complete wheel values for each band (L0, L1, L2, and L3) were recorded for
with a robust support structure. The tire designs were global displacement measurements across all tire variants
manufactured through a DLP AM process, using a 3D (Tire 1, Tire 2, and Tire 3). These localized deformation
printer (3D Systems Inc., United States of America [USA]) values for different bands indicate local stiffness in specific
and a flexible, impact-resistant resin with high toughness, band regions.
FLEX-BLK 20. The DLP printer uses an ultraviolet (UV)
lamp with a 405 nm wavelength and a high-definition 2.3. Finite element analysis
digital micromirror device (DMD) chip with a pixel size
of 65 μm. The layer thickness used for printing was 50 μm. Numerical FEA for simulating the compression
The resin used has a density and viscosity of 1.11 g/cm³ behavior of the NPTs was conducted using the static
and 2250 cps, respectively. 50 structural module of ANSYS software (version 2024
R1) to validate the experimental findings. The objective
2.2. Experimental testing was to accurately constrain the problem and simulate
Compression testing was performed on the tire samples compressive loading in the radial direction along a flat
®
using the MTS Criterion Electromechanical Test road surface. Computer-aided design (CAD) of the tire
System (equipped with a 50 kN load cell) to evaluate the from nTopology was imported into Ansys Workbench,
vertical deformation of the tires. A custom test rig was and a tetrahedron mesh was used for all models.
designed and manufactured to replicate the boundary A convergence study was conducted on mesh sizes
conditions of a tire under operation. The fixture was ranging from 0.2 to 1.0 mm to determine an appropriate
made of a 1040 steel shaft that was turned down to fit element size for this FEA study with convergence at
the D-clevis on the load frame. The axel that supports
the tire was then attached to the shaft using a 3/4 inch
pin. A crosshead displacement rate of 0.02 mm/s was
used, which is equivalent to 10% of the sample thickness
per minute. The tire moves down and is compressed
against the bottom platten, which is analogous to the
tire surface in contact with the road, being compressed
by the weight of the vehicle. No standardized methods
for testing sub-scale tires were found in previously
Table 1. Local band regions for different tire designs
Tire design Wall thickness (mm) Layer thickness (mm)
L0 L1 L2 L3
Tire 1 1.0 3.4 4.5 4.3 4.4
Tire 2 1.0 – 1.5 3.4 4.4 4.0 3.9
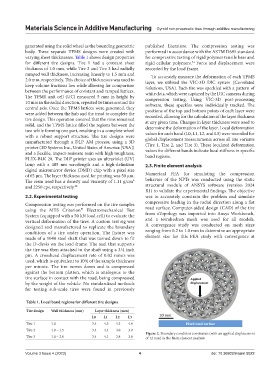
Figure 2. Boundary condition constraints (with an applied displacement
Tire 3 1.0 – 2.0 3.4 4.1 3.8 3.6 of 12 mm) in the finite element analysis
Volume 3 Issue 4 (2023) 4 doi: 10.36922/msam.5022