
Page 39 - MSAM-3-4
P. 39
Materials Science in Additive Manufacturing Gyroid non-pneumatic tires through additive manufacturing
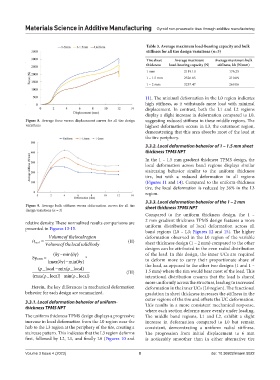
Table 3. Average maximum load-bearing capacity and bulk
stiffness for all tire design variations (n=3)
Tire sheet Average maximum Average maximum bulk
thickness load-bearing capacity (N) stiffness, kb (N/mm)
1 mm 2119.10 176.25
1 – 1.5 mm 2526.85 210.09
1 – 2 mm 3237.47 269.06
11). The minimal deformation in the L0 region indicates
high stiffness, as it withstands more load with minimal
displacement. In contrast, both the L1 and L2 regions
display a slight increase in deformation compared to L0,
Figure 8. Average force versus displacement curves for all tire design suggesting reduced stiffness in these middle regions. The
variations highest deformation occurs in L3, the outermost region,
demonstrating that this area absorbs most of the load at
the tire periphery.
3.3.2. Local deformation behavior of 1 – 1.5 mm sheet
thickness TPMS NPT
In the 1 – 1.5 mm gradient thickness TPMS design, the
local deformation across band regions displays similar
staircasing behavior similar to the uniform thickness
tire, but with a reduced deformation in all regions
(Figures 11 and 14). Compared to the uniform-thickness
tire, the local deformation is reduced by 36% in the L3
region.
3.3.3. Local deformation behavior of the 1 – 2 mm
Figure 9. Average bulk stiffness versus deformation curves for all tire sheet thickness TPMS NPT
design variations (n = 3)
Compared to the uniform thickness design, the 1 –
relative density. These normalized results comparisons are 2 mm gradient thickness TPMS design features a more
presented in Figures 13-15. uniform distribution of local deformation across all
band regions (L0 – L3; Figures 12 and 15). The higher
Volumeof thelocalregion deformation observed in the L0 region of the variable
ρ local = Volumeof thelocalsolidbody (II) sheet thickness design (1 – 2 mm) compared to the other
designs can be attributed to the even radial distribution
( δymin( δy) of the load. In this design, the inner UCs are required
−
δynorm = *
(
( maxy) miny) to deform more to carry their proportionate share of
δ (
δ −
(_ − ρ local) the load, as opposed to the other two designs (1 and 1 –
ρ localmin(_
1.5 mm) where the rim would bear most of the load. This
( maax(_ρ local)− min( _ρ local) (III) intentional distribution ensures that the load is shared
more uniformly across the structure, leading to increased
Herein, the key differences in mechanical deformation deformation in the inner UCs (L0 region). The functional
behavior for each design are summarized. gradation in sheet thickness increases the stiffness in the
3.3.1. Local deformation behavior of uniform- outer regions of the tire and offsets the UC deformation.
thickness TPMS NPT This results in a more consistent mechanical response,
where each section deforms more evenly under loading.
The uniform thickness TPMS design displays a progressive The middle band regions, L1 and L2, exhibit a slight
increase in local deformation from the L0 region near the increase in deformation compared to L0 but remain
hub to the L3 region at the periphery of the tire, creating a consistent, demonstrating a uniform radial stiffness.
staircase pattern. This indicates that the L3 region deforms The progression from initial displacement to 6 mm
first, followed by L2, L1, and finally L0 (Figures 10 and is noticeably smoother than in either alternative tire
Volume 3 Issue 4 (2023) 8 doi: 10.36922/msam.5022