
Page 38 - MSAM-3-4
P. 38
Materials Science in Additive Manufacturing Gyroid non-pneumatic tires through additive manufacturing
UCs collapsing first and progressively transferring the load Force
to the inner regions. A similar staircasing effect was observed kb = (I)
for the deformation of 1.0 – 1.5mm sub-scale tire. Displacement
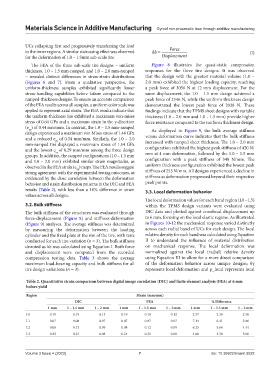
The FEA of the three sub-scale tire designs – uniform Figure 8 illustrates the quasi-static compression
thickness, 1.0 – 1.5 mm-ramped, and 1.0 – 2.0 mm-ramped responses for the three tire designs. It was observed
– revealed distinct differences in stress-strain distributions that the design with the greatest material volume (1.0 –
(Figures 6 and 7). From a qualitative perspective, the 2.0 mm) exhibited the highest loading capacity, reaching
uniform-thickness samples exhibited significantly lower a peak force of 3056 N at 12 mm displacement. For the
stress-handling capabilities before failure compared to the same displacement, the 1.0 – 1.5 mm design achieved a
ramped-thickness designs. To ensure an accurate comparison peak force of 2546 N, while the uniform thickness design
of the FEA results across all samples, a uniform color scale was demonstrated the lowest peak force of 2038 N. These
applied to represent axial strain. The FEA results indicate that findings indicate that the TPMS sheet designs with variable
the uniform-thickness tire exhibited a maximum von-mises thickness (1.0 – 2.0 mm and 1.0 – 1.5 mm) provide higher
stress of 0.64 GPa and a maximum strain in the y-direction force resistance compared to the uniform thickness design.
(e ) of 0.44 mm/mm. In contrast, the 1.0 – 1.5 mm-ramped
yy
design experienced a maximum von Mises stress of 1.44 GPa As displayed in Figure 9, the bulk average stiffness
and a reduced e of 0.34 mm/mm. Similarly, the 1.0 – 2.0 versus deformation curve indicates that the bulk stiffness
yy
mm-ramped tire displayed a maximum stress of 1.54 GPa increased with ramped sheet thickness. The 1.0 – 2.0 mm
and the lowest e of 0.29 mm/mm among the three design configuration exhibited the highest peak stiffness of 420 N/
yy
groups. In addition, the ramped configurations (1.0 – 1.5 mm mm at 4 mm deformation, followed by the 1.0 – 1.5 mm
and 1.0 – 2.0 mm) exhibited similar strain magnitudes, as configuration with a peak stiffness of 348 N/mm. The
observed in the FEA strain (e ) maps. The FEA results suggest uniform thickness configuration exhibited the lowest peak
yy
strong agreement with the experimental testing outcomes, as stiffness of 253 N/mm. All designs experienced a decline in
evidenced by the close correlation between the deformation stiffness as deformation progressed beyond their respective
behavior and strain distribution patterns in the DIC and FEA peak points.
results (Table 2), with less than a 10% difference in strain 3.3. Local deformation behavior
values across all designs.
The local deformation values for each band region (L0 – L3)
3.2. Bulk stiffness within the TPMS design variants were evaluated using
The bulk stiffness of the structures was evaluated through DIC data and plotted against crosshead displacement up
force-displacement (Figure 8) and stiffness-deformation to 6 mm, focusing on the local elastic regime. As illustrated
(Figure 9) analyses. The average stiffness was determined in Figures 10-12 the mechanical response varied distinctly
by measuring the deformation between the loading across each radial band of UCs for each design. The local
cylinder and the fixed plate at the rim of the tire, with tests relative density for each band was calculated using Equation
conducted for each tire variation (n = 3). The bulk stiffness II to understand the influence of material distribution
denoted as kb was calculated using Equation I. Both force on mechanical response. The local deformation was
and displacement were computed from the recorded normalized against the local (radial) relative density
compression testing data. Table 3 shows the average using Equation III to allow for a more direct comparison
maximum load-bearing capacity and bulk stiffness for all of the deformation behavior across unique designs; δy
tire design variations (n = 3). represents local deformation and ρ_local represents local
Table 2. Quantitative strain comparison between digital image correlation (DIC) and finite element analysis (FEA) at 6 mm
before yield
Region Strain (mm/mm)
DIC FEA % Difference
1 mm 1 – 1.5 mm 1 – 2 mm 1 mm 1 – 1.5 mm 1 – 2 mm 1 mm 1 – 1.5 mm 1 – 2 mm
L0 0.19 0.19 0.13 0.19 0.18 0.12 2.37 3.36 2.40
L1 0.07 0.08 0.07 0.07 0.07 0.07 7.14 6.41 2.86
L2 0.08 0.13 0.09 0.08 0.12 0.09 6.25 5.60 4.44
L3 0.25 0.21 0.08 0.24 0.21 0.08 4.00 3.30 5.00
Volume 3 Issue 4 (2023) 7 doi: 10.36922/msam.5022