
Page 106 - MSAM-4-1
P. 106
Materials Science in Additive Manufacturing Topology optimization of an aluminum bicycle pedal
crank using laser powder bed fusion
compliance with industry standards and verify long-term comparative study assessed the roughness of two surfaces
durability under cyclic loading conditions. on the opposite sides of a complementary part. This analysis
examined the W-profile in both transversal and longitudinal
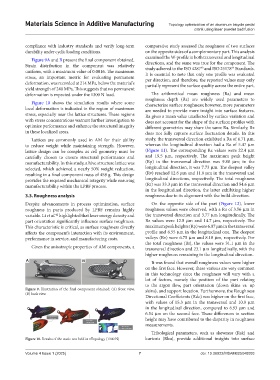
Figure 9A and B present the final component obtained.
Strain distribution in the component was relatively directions, and the same was true for the component. The
study adhered to the ISO 4287 and ISO 25178 Standards.
43
44
uniform, with a maximum value of 0.0016. The maximum It is essential to note that only one profile was evaluated
stress, an important metric for evaluating permanent per direction, and therefore, the reported values may only
deformation, was recorded at 214 MPa, below the material’s partially represent the surface quality across the entire part.
yield strength of 240 MPa. This suggests that no permanent
deformation is expected under the 1300 N load. The arithmetical mean roughness (Ra) and mean
roughness depth (Rz) are widely used parameters to
Figure 10 shows the simulation results where some characterize surface roughness; however, more parameters
local deformation is indicated in the region of maximum are needed to provide more insight into surface features.
stress, especially near the lattice structures. These regions Ra gives a mean value unaffected by surface variation and
with stress concentrations warrant further investigation to does not account for the shape of the surface; profiles with
optimize performance and enhance the structural integrity different geometries may share the same Ra. Similarly, Rz
in these localized areas. does not fully capture surface fluctuation details. In this
Lattices are commonly used in AM for their ability study, the transversal direction exhibited a Ra of 6.71 µm,
to reduce weight while maintaining strength. However, whereas the longitudinal direction had a Ra of 5.47 µm
lattice design can be complex as cell geometry must be (Figure 11). The corresponding Rz values were 22.4 µm
carefully chosen to ensure structural performance and and 19.5 µm, respectively. The maximum peak height
manufacturability. In this study, a hive structure lattice was (Rp) in the transversal direction was 9.88 µm; in the
selected, which achieved a nearly 50% weight reduction, longitudinal direction, it was 7.73 µm. The deepest valley
resulting in a final component mass of 458 g. This design (Rv) reached 12.6 µm and 11.8 µm in the transversal and
provides the required mechanical integrity while ensuring longitudinal directions, respectively. The total roughness
manufacturability within the LPBF process. (Rt) was 33.3 µm in the transversal direction and 54.6 µm
in the longitudinal direction, the latter exhibiting higher
3.3. Roughness analysis roughness due to its alignment with the build direction.
Despite advancements in process optimization, surface On the opposite side of the part (Figure 12), lower
roughness in parts produced by LPBF remains highly roughness values were observed, with a Ra of 3.56 µm in
variable. Li et al. highlighted that laser energy density and the transversal direction and 3.77 µm longitudinally. The
42
part orientation significantly influence surface roughness. Rz values were 12.8 µm and 14.7 µm, respectively. The
This characteristic is critical, as surface roughness directly maximum peak heights (Rp) were 6.07 µm in the transversal
affects the component’s interaction with its environment, profile and 6.55 µm in the longitudinal one. The deepest
performance in service, and manufacturing costs. valleys (Rv) were 6.75 µm and 8.10 µm, respectively. For
the total roughness (Rt), the values were 31.1 µm in the
Given the anisotropic properties of AM components, a transversal direction and 23.1 µm longitudinally, with the
higher roughness remaining in the longitudinal direction.
A B It was found that overall roughness values were higher
on the first face. However, these various are very common
in this technology since the roughness will vary with a
lot of factors, namely the position of the part relating
to the argon flow, part orientation (down skins vs. up
Figure 9. Illustration of the final component obtained: (A) front view, skins), and support location. Furthermore, the Roughness
(B) back view
Directional Coefficients (Rdc) was higher on the first face,
with values of 15.3 µm in the transversal and 10.9 µm
in the longitudinal direction, compared to 6.93 µm and
6.54 µm on the second face. These differences in section
height may have contributed to the disparity in roughness
measurements.
Tribological parameters, such as skewness (Rsk) and
Figure 10. Results of the static test held in nTopology (1300 N) kurtosis (Rku), provide additional insights into surface
Volume 4 Issue 1 (2025) 7 doi: 10.36922/MSAM025040003