
Page 109 - MSAM-4-1
P. 109
Materials Science in Additive Manufacturing Topology optimization of an aluminum bicycle pedal
crank using laser powder bed fusion
A B
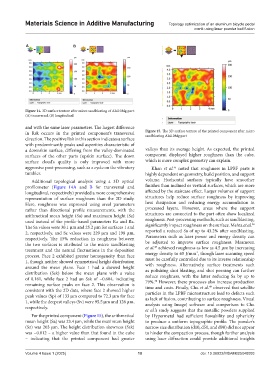
Figure 14. 3D surface texture after micro sandblasting of Alsi10Mg part:
(A) transversal, (B) longitudinal
and with the same laser parameters. The largest difference
in Rsk occurs in the printed component’s transversal Figure 15. The 3D surface texture of the printed component after micro
sandblasting Alsi10Mg part
direction. The positive Rsk in this section indicates a surface
with predominantly peaks and asperities characteristic of
a downskin surface, differing from the valley-dominated valleys than its average height. As expected, the printed
surfaces of the other parts (upskin surface). The down component displayed higher roughness than the cube,
surface cloud’s quality is only improved with more which is more complex geometry can explain.
aggressive post-processing, such as a cycle on the vibratory Khan et al. noted that roughness in LPBF parts is
45
tumbler. highly dependent on geometry, build position, and support
Additional topological analysis using a 3D optical volume. Horizontal surfaces typically have smoother
profilometer (Figure 14A and B for transversal and finishes than inclined or vertical surfaces, which are more
longitudinal, respectively) provided a more comprehensive affected by the staircase effect. Larger volumes of support
representation of surface roughness than the 2D study. structures help reduce surface roughness by improving
Here, roughness was expressed using areal parameters heat dissipation and reducing energy accumulation in
rather than directional profile measurements, with the processed layers. However, areas where the support
arithmetical mean height (Sa) and maximum height (Sz ) structures are connected to the part often show localized
used instead of the profile-based parameters Ra and Rz . roughness. Post-processing methods, such as sandblasting,
46
The Sa values were 30.1 µm and 25.2 µm for surfaces 1 and significantly impact roughness on the surface. Mehta et al.
2, respectively, and Sz values were 229 µm and 198 µm, reported a reduced Sa of up to 43.2% after sandblasting.
respectively. The 15% reduction in roughness between Parameters such as laser power and energy density can
the two surfaces is attributed to the micro sandblasting be adjusted to improve surface roughness. Maamoun
47
treatment and the natural fluctuations in the deposition et al. achieved roughness as low as 4.5 µm by increasing
process. Face 2 exhibited greater homogeneity than face energy density to 65 J/mm³, though laser scanning speed
1, though neither showed symmetrical height distribution must be carefully controlled due to its inverse relationship
around the mean plane. Face 1 had a skewed height with roughness. Alternatively, surface treatments such
as polishing shot blasting, and shot peening can further
distribution (Ssk) below the mean plane with a value reduce roughness, with the latter reducing Sa by up to
of 0.161, while face 2 had an Ssk of −0.604, indicating 79%. However, these processes also increase production
48
remaining surface peaks on face 2. This observation is time and costs. Finally, Chu et al. observed that satellite
49
consistent with the 2D data, where face 2 showed higher particles in the LPBF microstructure lead to defects such
peak values (Sp) of 133 µm compared to 72.3 µm for face as lack of fusion, contributing to surface roughness. Visual
1, while the deepest valleys (Sv) were 95.5 µm and 126 µm, analysis using ImageJ software and comparison to Chu
respectively.
et al.’s study suggests that the metallic powders supplied
For the printed component (Figure 15), the arithmetical by Hypermetal had sufficient flowability and sphericity
mean height (Sa) was 23.4 µm, while the maximum height to produce a uniform topographic profile. The powder’s
(Sz) was 203 µm. The height distribution skewness (Ssk) narrow size distribution (d10, d50, and d90) did not appear
was −0.812 – a higher value than that found in the cube to hinder the compaction process, though further analysis
– indicating that the printed component had greater using laser diffraction could provide additional insights
Volume 4 Issue 1 (2025) 10 doi: 10.36922/MSAM025040003