
Page 110 - MSAM-4-1
P. 110
Materials Science in Additive Manufacturing Topology optimization of an aluminum bicycle pedal
crank using laser powder bed fusion
The results indicate that the dimensional accuracy of
the printed component does not meet the requirements
for integration into a functional bicycle component, where
high precision is essential. The most problematic deviations
were observed in the holes intended for screw threads,
where significant reductions in available space could
compromise the component’s functionality. Achieving
greater dimensional accuracy is paramount, particularly
for applications where precision is critical.
Dimensional accuracy in LPBF can be influenced by
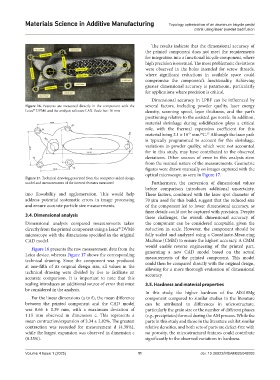
Figure 16. Features are measured directly in the component with the several factors, including powder quality, laser energy
®
Leica DVM6 and the analysis software LAX. Scale bar: 10 mm density, scanning speed, layer thickness, and the part’s
positioning relative to the assisted gas nozzle. In addition,
material shrinkage during solidification plays a critical
role, with the thermal expansion coefficient for this
material being 2.1 × 10 ⁵ mm/°C. Although the laser path
-
17
is typically programmed to account for this shrinkage,
variations in powder quality, which were not accounted
for in this study, may have contributed to the observed
deviations. Other sources of error in this analysis stem
from the manual nature of the measurements. Geometric
figures were drawn manually on images captured with the
optical microscope, as seen in Figure 17.
Figure 17. Technical drawing generated from the computer-aided design
model and measurements of the interest features measured Furthermore, the conversion of dimensional values
before comparison introduces additional uncertainty.
into flowability and agglomeration. This would help These factors, combined with the laser spot diameter of
address potential systematic errors in image processing 70 µm used for this build, suggest that the reduced size
and ensure accurate particle size measurements. of the component led to lower dimensional accuracy, as
finer details could not be captured with precision. Despite
3.4. Dimensional analysis these challenges, the overall dimensional accuracy of
Dimensional analysis compared measurements taken the component can be considered acceptable, given the
directly from the printed component using a Leica DVM6 reduction in scale. However, the component should be
®
microscope with the dimensions specified in the original fully scaled and analyzed using a Coordinate-Measuring
CAD model. Machine (CMM) to ensure the highest accuracy. A CMM
would enable reverse engineering of the printed part,
Figure 16 presents the raw measurement data from the
Leica device, whereas Figure 17 shows the corresponding generating a new CAD model based on the actual
measurements of the printed component. This model
technical drawing. Since the component was produced could then be compared directly with the original design,
at one-fifth of its original design size, all values in the allowing for a more thorough evaluation of dimensional
technical drawing were divided by five to facilitate an accuracy.
accurate comparison. It is important to note that this
scaling introduces an additional source of error that must 3.5. Hardness and material properties
be considered in the analysis.
In this study, the higher hardness of the AlSi10Mg
For the linear dimensions (a to f), the mean difference component compared to similar studies in the literature
between the printed component and the CAD model can be attributed to differences in microstructure,
was 0.66 ± 0.39 mm, with a maximum deviation of particularly the grain size or the number of different phases
1.15 mm observed in dimension c. This represents a (e.g., precipitates) formed during the AM process. While the
mean contraction/expansion of 3.34 ± 2.82%. The greatest parts in this study and those in the literature exhibit similar
contraction was recorded for measurement d (4.38%), relative densities, and both sets of parts are defect-free with
while the largest expansion was observed in dimension c no porosity, the microstructural features could contribute
(8.35%). significantly to the observed variations in hardness.
Volume 4 Issue 1 (2025) 11 doi: 10.36922/MSAM025040003