
Page 73 - MSAM-4-1
P. 73
Materials Science in Additive Manufacturing In situ electromagnetic field manipulation during LMD
A
B
C
D
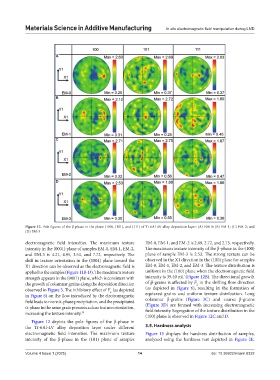
Figure 12. Pole figures of the β-phase in the plane (100), (101), and (111) of Ti-6Al-4V alloy deposition layer: (A) EM-0; (B) EM-1; (C) EM-2; and
(D) EM-3
electromagnetic field intensities. The maximum texture EM-0, EM-1, and EM-2 is 2.69, 2.72, and 2.75, respectively.
intensity in the (0001) plane of samples EM-0, EM-1, EM-2, The maximum texture intensity of the β-phase in the (100)
and EM-3 is 4.21, 4.95, 3.54, and 7.72, respectively. The plane of sample EM-3 is 2.53. The strong texture can be
shift in texture orientation in the (0001) plane toward the observed in the X1 direction in the (100) plane for samples
X1 direction can be observed as the electromagnetic field is EM-0, EM-1, EM-2, and EM-3. The texture distribution is
applied to the samples (Figure 11B-D). The maximum texture uniform in the (100) plane when the electromagnetic field
strength appears in the (0001) plane, which is consistent with intensity is 39.40 mT (Figure 12B). The directional growth
the growth of columnar grains along the deposition direction of β-grains is affected by F in the shifting flow direction
L
observed in Figure 3. The inhibitory effect of F (as depicted (as depicted in Figure 6), resulting in the formation of
L
in Figure 6) on the flow introduced by the electromagnetic equiaxed grains and uniform texture distribution. Long
field leads to more α-phase precipitation, and the precipitated columnar β-grains (Figure 3C) and coarse β-grains
α-phase in the same grain presents a close texture orientation, (Figure 3D) are formed with increasing electromagnetic
field intensity. Segregation of the texture distribution in the
increasing the texture intensity. 39
(100) plane is observed in Figure 12C and D.
Figure 12 depicts the pole figures of the β-phase in
the Ti-6Al-4V alloy deposition layer under different 3.5. Hardness analysis
electromagnetic field intensities. The maximum texture Figure 13 displays the hardness distribution of samples,
intensity of the β-phase in the (101) plane of samples analyzed using the hardness test depicted in Figure 2E.
Volume 4 Issue 1 (2025) 14 doi: 10.36922/msam.8332