
Page 70 - MSAM-4-1
P. 70
Materials Science in Additive Manufacturing In situ electromagnetic field manipulation during LMD
A B C
D E F
G H I
J K L
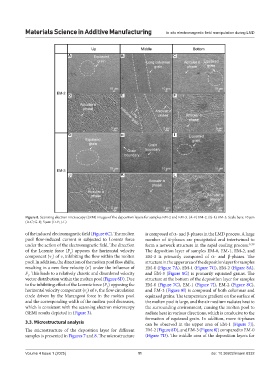
Figure 8. Scanning electron microscopy (SEM) images of the deposition layers for samples EM-2 and EM-3. (A-F) EM-2. (G-L) EM-3. Scale bars: 10 µm
(A-C; G-I); 5 µm (D-F; J-L)
of the induced electromagnetic field (Figure 6C). The molten is composed of α- and β-phases in the LMD process. A large
pool flow-induced current is subjected to Lorentz force number of α-phases are precipitated and intertwined to
under the action of the electromagnetic field. The direction form a network structure in the rapid cooling process. 37,38
of the Lorentz force (F ) opposes the horizontal velocity The deposition layer of samples EM-0, EM-1, EM-2, and
L
component (v ) of v, inhibiting the flow within the molten EM-3 is primarily composed of α- and β-phases. The
1
pool. In addition, the direction of the molten pool flow shifts, structure in the upper area of the deposition layer for samples
resulting in a new flow velocity (v’) under the influence of EM-0 (Figure 7A), EM-1 (Figure 7G), EM-2 (Figure 8A),
F . This leads to a relatively chaotic and disordered velocity and EM-3 (Figure 8G) is primarily equiaxed grains. The
L
vector distribution within the molten pool (Figure 6D). Due structure at the bottom of the deposition layer for samples
to the inhibiting effect of the Lorentz force (F ) opposing the EM-0 (Figure 7C), EM-1 (Figure 7I), EM-2 (Figure 8C),
L
horizontal velocity component (v ) of v, the flow circulation and EM-3 (Figure 8I) is composed of both columnar and
1
circle driven by the Marangoni force in the molten pool equiaxed grains. The temperature gradient on the surface of
and the corresponding width of the molten pool decreases, the molten pool is large, and the air medium radiates heat to
which is consistent with the scanning electron microscopy the surrounding environment, causing the molten pool to
(SEM) results depicted in (Figure 3). radiate heat in various directions, which is conducive to the
formation of equiaxed grain. In addition, more α-phases
3.3. Microstructural analysis can be observed in the upper area of EM-1 (Figure 7J),
The microstructure of the deposition layer for different EM-2 (Figure 8D), and EM-3 (Figure 8J) compared to EM-0
samples is presented in Figures 7 and 8. The microstructure (Figure 7D). The middle area of the deposition layers for
Volume 4 Issue 1 (2025) 11 doi: 10.36922/msam.8332