
Page 65 - MSAM-4-1
P. 65
Materials Science in Additive Manufacturing In situ electromagnetic field manipulation during LMD
property simulation software JMatPro and adjusted based The chemical composition of the Ti-6Al-4V powder is
on reference literature. 26,33-36 The material thermophysical presented in Table 2. The laser power of 1400 W, scan rate of
parameters indicate significant variations in temperature 7.5 mm/s, and powder feed rate of 8.5 g/min were selected
during the numerical simulation of LMD, and the for the LMD experiments with and without electromagnetic
influence of temperature-dependent thermophysical field, and the morphology, microstructure, and hardness
parameters cannot be ignored. The crucial parameters of LMD Ti-6Al-4V were studied. The electromagnetic
(thermal conductivity, specific heat capacity, viscosity, and field was controlled by the input voltage and current of
surface tension) utilized in the simulation are described as the power supply. The LMD experiments were conducted
functions of temperature (Figure 1C-F). with different output voltage and current settings, and the
experiment parameters are listed in Table 3.
2.5. Experimental process
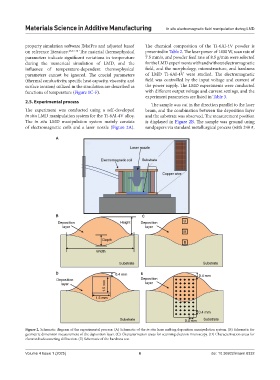
The sample was cut in the direction parallel to the laser
The experiment was conducted using a self-developed beam, and the combination between the deposition layer
in situ LMD manipulation system for the Ti-6Al-4V alloy. and the substrate was observed. The measurement position
The in situ LMD manipulation system mainly consists is displayed in Figure 2B. The sample was ground using
of electromagnetic coils and a laser nozzle (Figure 2A). sandpapers via standard metallurgical process (with 240 #,
A
B C
D E
Figure 2. Schematic diagram of the experimental process: (A) Schematic of the in situ laser melting deposition manipulation system. (B) Schematic for
geometric dimension measurement of the deposition layer. (C) Characterization areas for scanning electron microscopy. (D) Characterization areas for
electron backscattering diffraction. (E) Schematic of the hardness test
Volume 4 Issue 1 (2025) 6 doi: 10.36922/msam.8332