
Page 154 - MSAM-4-3
P. 154
Materials Science in Additive Manufacturing L-PBF Ti-10Ta-2Nb-2Zr: Microstructure and Strength
2.5.2. Microstructural analysis 3. Results and discussion
Samples for microstructural analysis were prepared using 3.1. Effect of L-PBF parameters on the relative
standard metallographic procedures. After grinding density of Ti-10Ta-2Nb-2Zr alloy
and polishing as described above, the specimens were
etched using Kroll’s reagent (2 mL HF, 6 mL HNO , and Table 2 presents the density values obtained using the
3
92 mL H O) for 15 – 20 s at room temperature to reveal hydrostatic weighing method. The theoretical density
2
microstructural features. of Ti-10Ta-2Nb-2Zr alloy calculated using JMatPro 11
thermodynamic software was 4.9400 g/cm . Hydrostatic
3
Microstructural examination was performed using weighing revealed absolute density values ranging from
a SEM (MIRA 3, TESCAN, Czech Republic) equipped 4.9153 to 4.9355 g/cm , with the highest value of 4.9355
3
with an EDS detector for compositional analysis. ± 0.0015 g/cm achieved at energy densities of 70 J/mm
3
3
Imaging was conducted at accelerating voltages (laser power P = 280 W, scanning speed V = 800 mm/s).
between 15 and 20 kV using secondary electron and
backscattered electron detectors to optimize contrast The lowest relative density of 99.49 ± 0.21% was
3
between different phases. recorded at an energy density of 116.7 J/mm (P = 280 W,
V = 600 mm/s, h = 50 μm), which may indicate the
Phase analysis was performed using an X-ray formation of keyhole porosity defects due to excessive
diffractometer (D8 Advance, Bruker, Germany) with energy input, consistent with findings for similar Ti-based
CuK-α radiation (λ = 1.5418 Å) operated at 40 kV and alloys. At the minimum energy density of 50.0 J/mm
31
3
40 mA. X-ray diffraction (XRD) patterns were recorded (P = 250 W, V = 1000 mm/s, h = 50 μm), the relative
in the 2θ range of 30 – 90° with a step size of 0.02° and density reached 4.9212 ± 0.0054, demonstrating sufficient
a counting time of 2 s per step. Phase identification was material melting.
performed using the International Centre of Diffraction
Data PDF-4 + database. The dependence of relative density on volumetric
energy density (Figure 3) demonstrates a non-monotonic
2.5.3. Mechanical testing behavior. The highest density values were achieved in the
range of 60 – 90 J/mm , with a peak value of 99.91% at
3
Vickers microhardness measurements were conducted 70 J/mm . Lower energy densities (<60 J/mm ) resulted in
3
3
using a hardness tester (Wilson VH1202, Buehler, USA) insufficient melting and increased porosity, while excessive
under a load of 500 g (HV ) with a dwell time of 15 s. At energy input (>90 J/mm ) led to the formation of keyhole
3
0.5
least 10 indentations were made on each sample to ensure defects. The optimal energy density window appears to be
statistical significance, with indentation sites selected to broader than typically reported for binary Ti-Ta alloys, 14,16
avoid proximity to pores or sample edges.
suggesting enhanced processability of the quaternary
Tensile tests were conducted on a universal testing composition.
machine (Zwick/Roell Z100, ZwickRoell GmbH & Co., These results underscore the importance of optimizing
Germany) at room temperature with a strain rate of 0.001 s L-PBF parameters to achieve near-full densification
−1
according to ASTM E8/E8M standard. A minimum of (>99.85%) for biomedical implants, where high density
five specimens were tested for each processing condition
to ensure reproducibility. The elastic modulus was
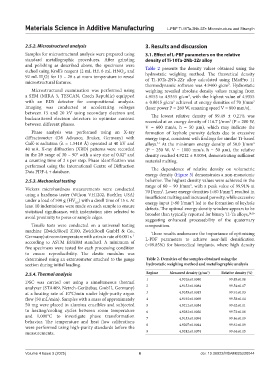
determined using an extensometer attached to the gauge Table 2. Densities of the samples obtained using the
section during initial loading. hydrostatic weighing method and metallographic analysis
3
2.5.4. Thermal analysis Regime Measured density (g/cm ) Relative density (%)
1 4.9326±0.0040 99.85±0.08
DSC was carried out using a simultaneous thermal
analyzer (STA409, Netzch-Gerätebau GmbH, Germany) 2 4.9153±0.0084 99.54±0.17
at a heating rate of 10°C/min under high-purity argon 3 4.9355±0.0015 99.91±0.03
flow (50 mL/min). Samples with a mass of approximately 4 4.9192±0.0069 99.58±0.14
50 mg were placed in alumina crucibles and subjected 5 4.9212±0.0054 99.62±0.11
to heating/cooling cycles between room temperature 6 4.9282±0.0030 99.72±0.06
and 1,000°C to investigate phase transformation 7 4.9153±0.0094 99.46±0.19
behavior. The temperature and heat flow calibrations
were performed using high-purity standards before the 8 4.9207±0.0044 99.61±0.09
measurements. 9 4.9242±0.0074 99.64±0.15
Volume 4 Issue 3 (2025) 6 doi: 10.36922/MSAM025220044