
Page 156 - MSAM-4-3
P. 156
Materials Science in Additive Manufacturing L-PBF Ti-10Ta-2Nb-2Zr: Microstructure and Strength
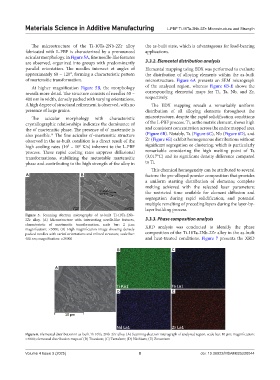
The microstructure of the Ti-10Ta-2Nb-2Zr alloy the as-built state, which is advantageous for load-bearing
fabricated with L-PBF is characterized by a pronounced applications.
acicular morphology. In Figure 5A, fine needle-like features
are observed, organized into groups with predominantly 3.3.2. Elemental distribution analysis
parallel orientation. The needles intersect at angles of Elemental mapping using EDX was performed to evaluate
approximately 60 – 120°, forming a characteristic pattern the distribution of alloying elements within the as-built
of martensitic transformation. microstructure. Figure 6A presents an SEM micrograph
At higher magnification Figure 5B, the morphology of the analyzed region, whereas Figure 6B-E shows the
reveals more detail. The structure consists of needles 50 – corresponding elemental maps for Ti, Ta, Nb, and Zr,
400 nm in width, densely packed with varying orientations. respectively.
A high degree of structural refinement is observed, with no The EDX mapping reveals a remarkably uniform
presence of large grains. distribution of all alloying elements throughout the
The acicular morphology with characteristic microstructure, despite the rapid solidification conditions
crystallographic relationships indicates the dominance of of the L-PBF process. Ti, as the matrix element, shows high
the α’ martensitic phase. The presence of α’ martensite is and consistent concentration across the entire mapped area
also possible. The fine acicular α’-martensitic structure (Figure 6B). Notably, Ta (Figure 6C), Nb (Figure 6D), and
14
observed in the as-built condition is a direct result of the Zr (Figure 6E) exhibit homogeneous distributions without
high cooling rates (10 – 10 K/s) inherent to the L-PBF significant segregation or clustering, which is particularly
6
5
process. These rapid cooling rates suppress diffusional remarkable considering the high melting point of Ta
transformations, stabilizing the metastable martensitic (3,017°C) and its significant density difference compared
phase and contributing to the high strength of the alloy in to Ti.
This chemical homogeneity can be attributed to several
A B factors: the pre-alloyed powder composition that provides
a uniform starting distribution of elements; complete
melting achieved with the selected laser parameters;
the restricted time available for element diffusion and
segregation during rapid solidification; and potential
multiple remelting of preceding layers during the layer-by-
layer building process.
Figure 5. Scanning electron micrographs of as-built Ti-10Ta-2Nb-
2Zr alloy. (A) Microstructure with intersecting needle-like features, 3.3.3. Phase composition analysis
characteristic of martensitic transformation, scale bar: 2 μm; XRD analysis was conducted to identify the phase
magnification: ×5000; (B) High-magnification image showing densely
packed needles with varied orientations and refined structure, scale bar: composition of the Ti-10Ta-2Nb-2Zr alloy in the as-built
400 nm; magnification: ×20000 and heat-treated conditions. Figure 7 presents the XRD
B C
A
D E
Figure 6. Elemental distribution in as-built Ti-10Ta-2Nb-2Zr alloy. (A) Scanning electron micrograph of analyzed region, scale bar: 10 μm; magnification:
×4000; elemental distribution maps of (B) Titanium; (C) Tantalum; (D) Niobium; (E) Zirconium
Volume 4 Issue 3 (2025) 8 doi: 10.36922/MSAM025220044