
Page 158 - MSAM-4-3
P. 158
Materials Science in Additive Manufacturing L-PBF Ti-10Ta-2Nb-2Zr: Microstructure and Strength
A B
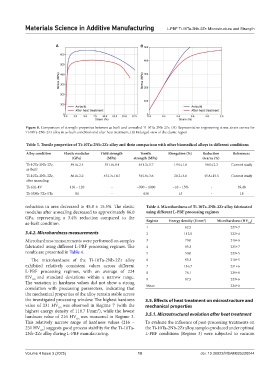
Figure 8. Comparison of strength properties between as-built and annealed Ti-10Ta-2Nb-2Zr. (A) Representative engineering stress-strain curves for
Ti-10Ta-2Nb-2Zr alloy in as-built condition and after heat treatment; (B) Enlarged view of the elastic region
Table 3. Tensile properties of Ti‑10Ta‑2Nb‑2Zr alloy and their comparison with other biomedical alloys in different conditions
Alloy condition Elastic modulus Yield strength Tensile Elongation (%) Reduction References
(GPa) (MPa) strength (MPa) in area (%)
Ti-10Ta-2Nb-2Zr, 89.0±2.4 551.8±8.4 641.2±5.7 19.0±1.8 58.0±2.3 Current study
as-built
Ti-10Ta-2Nb-2Zr, 86.0±2.2 452.3±14.7 545.0±3.6 20.2±3.6 45.8±15.5 Current study
after annealing
Ti-6Al-4V 110 – 120 - ~900 – 1000 ~10 – 15% - 39,40
Ti-35Nb-7Zr-5Ta 81 - 630 15 - 18
reduction in area decreased to 45.8 ± 15.5%. The elastic Table 4. Microhardness of Ti‑10Ta‑2Nb‑2Zr alloy fabricated
modulus after annealing decreased to approximately 86.0 using different L‑PBF processing regimes
GPa, representing a 3.4% reduction compared to the Regime Energy density (J/mm ) Microhardness (HV )
3
as-built condition. 0.5
1 62.5 227±7
3.4.2. Microhardness measurements 2 112.0 222±4
Microhardness measurements were performed on samples 3 70.0 216±6
fabricated using different L-PBF processing regimes. The 4 83.3 225±7
results are presented in Table 4. 5 50.0 223±5
The microhardness of the Ti-10Ta-2Nb-2Zr alloy 6 93.3 216±5
exhibited relatively consistent values across different 7 116.7 231±6
L-PBF processing regimes, with an average of 224 8 78.1 229±8
HV 0.5 and standard deviations within a narrow range. 9 87.5 223±6
The variation in hardness values did not show a strong
correlation with processing parameters, indicating that Mean – 224±6
the mechanical properties of the alloy remain stable across
the investigated processing window. The highest hardness 3.5. Effects of heat treatment on microstructure and
value of 231 HV was observed in Regime 7 (with the mechanical properties
0.5
highest energy density of 116.7 J/mm ), while the lowest
3
hardness value of 216 HV was measured in Regime 3. 3.5.1. Microstructural evolution after heat treatment
0.5
This relatively narrow range of hardness values (216 – To evaluate the influence of post-processing treatments on
231 HV ) suggests good process stability for the Ti-10Ta- the Ti-10Ta-2Nb-2Zr alloy, samples produced under optimal
0.5
2Nb-2Zr alloy during L-PBF manufacturing. L-PBF conditions (Regime 3) were subjected to vacuum
Volume 4 Issue 3 (2025) 10 doi: 10.36922/MSAM025220044