
Page 155 - MSAM-4-3
P. 155
Materials Science in Additive Manufacturing L-PBF Ti-10Ta-2Nb-2Zr: Microstructure and Strength
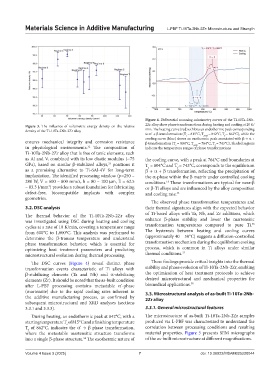
Figure 4. Differential scanning calorimetry curves of the Ti-10Ta-2Nb-
Figure 3. The influence of volumetric energy density on the relative 2Zr alloy show phase transformations during heating and cooling at 20 K/
density of the Ti-10Ta-2Nb-2Zr alloy min. The heating curve (red) exhibits an endothermic peak corresponding
to α’ → β transformation (T = 815°C, T peak = 842°C, T = 862°C), while the
f
s
cooling curve (blue) shows an exothermic peak associated with β → α +
ensures mechanical integrity and corrosion resistance β transformation (T = 804°C, T = 764°C, T = 743°C). Shaded regions
s
f
peak
in physiological environments. The composition of indicate the temperature ranges of phase transformations
32
Ti-10Ta-2Nb-2Zr alloy that is free of toxic elements, such
as Al and V, combined with its low elastic modulus (~75 the cooling curve, with a peak at 764°C and boundaries at
GPa), based on similar β-stabilized alloys, positions it T = 804°C and T = 743°C, corresponds to the equilibrium
33
s
f
as a promising alternative to Ti-6Al-4V for long-term β → α + β transformation, reflecting the precipitation of
implantation. The identified processing window (p=250 – the α-phase within the β matrix under controlled cooling
280 W, V = 600 – 800 mm/s, h = 80 – 100 μm, E = 62.5 conditions. These transformations are typical for near-β
13
– 83.3 J/mm ) provides a robust foundation for fabricating or β-Ti alloys and are influenced by the alloy composition
3
defect-free, biocompatible implants with complex and cooling rate. 35
geometries.
The observed phase transformation temperatures and
3.2. DSC analysis their thermal signatures align with the expected behavior
The thermal behavior of the Ti-10Ta-2Nb-2Zr alloy of Ti-based alloys with Ta, Nb, and Zr additions, which
was investigated using DSC during heating and cooling enhance β-phase stability and lower the martensitic
36
cycles at a rate of 10 K/min, covering a temperature range transformation temperatures compared to pure Ti.
from 600°C to 1,000°C. This analysis was performed to The hysteresis between heating and cooling curves
determine the β-transus temperature and understand (approximately 40 – 50°C) suggests a diffusion-controlled
phase transformation behavior, which is essential for transformation mechanism during the equilibrium cooling
optimizing heat treatment parameters and predicting process, which is common in Ti alloys under similar
microstructural evolution during thermal processing. thermal conditions. 37
The DSC curves (Figure 4) reveal distinct phase These findings provide critical insights into the thermal
transformation events characteristic of Ti alloys with stability and phase evolution of Ti-10Ta-2Nb-2Zr, enabling
β-stabilizing elements (Ta and Nb) and α-stabilizing the optimization of heat treatment protocols to achieve
elements (Zr). It should be noted that the as-built condition desired microstructural and mechanical properties for
after L-PBF processing contains metastable α’-phase biomedical applications. 38
(martensite) due to the rapid cooling rates inherent in 3.3. Microstructural analysis of as-built Ti-10Ta-2Nb-
the additive manufacturing process, as confirmed by 2Zr alloy
subsequent microstructural and XRD analyses (sections
3.3.1 and 3.3.3). 3.3.1. General microstructural features
During heating, an endothermic peak at 842°C, with a The microstructure of as-built Ti-10Ta-2Nb-2Zr samples
starting temperature T of 815°C and a finishing temperature produced via L-PBF was characterized to understand the
s
T of 862°C, indicates the α’ → β phase transformation, correlation between processing conditions and resulting
f
where the metastable martensitic structure transforms material properties. Figure 5 presents SEM micrographs
into a single β-phase structure. The exothermic nature of of the as-built microstructure at different magnifications.
34
Volume 4 Issue 3 (2025) 7 doi: 10.36922/MSAM025220044