
Page 66 - MSAM-4-3
P. 66
Materials Science in Additive Manufacturing Bead geometry prediction in laser-arc AM
A
B
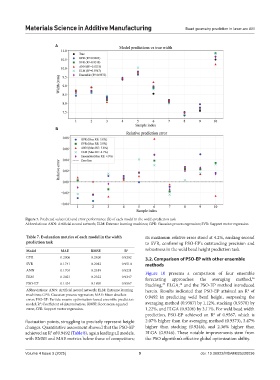
Figure 7. Predicted values (A) and error performance (B) of each model in the width prediction task
Abbreviations: ANN: Artificial neural network; ELM: Extreme learning machines; GPR: Gaussian process regression; SVR: Support vector regression
Table 7. Evaluation metrics of each model in the width its maximum relative error stood at 4.2%, ranking second
prediction task to SVR, confirming PSO-EP’s outstanding precision and
Model MAE RMSE R 2 robustness in the weld bead height prediction task.
GPR 0.2006 0.2400 0.9302 3.2. Comparison of PSO-EP with other ensemble
SVR 0.1741 0.2012 0.9510 methods
ANN 0.1704 0.2519 0.9231 Figure 10 presents a comparison of four ensemble
ELM 0.2021 0.2322 0.9347 forecasting approaches: the averaging method,
46
PSO-EP 0.1454 0.1890 0.9567 Stacking, ELGA, and the PSO-EP method introduced
47
48
Abbreviations: ANN: Artificial neural network; ELM: Extreme learning herein. Results indicated that PSO-EP attained an R of
2
machines; GPR: Gaussian process regression; MAE: Mean absolute 0.9492 in predicting weld bead height, surpassing the
error; PSO-EP: Particle swarm optimization-based ensemble prediction
model; R : Coefficient of determination; RMSE: Root mean squared averaging method (0.9387) by 1.12%, stacking (0.9378) by
2
error; SVR: Support vector regression. 1.22%, and ELGA (0.9206) by 3.11%. For weld bead width
prediction, PSO-EP achieved an R of 0.9567, which is
2
fluctuation points, struggling to precisely represent height 2.07% higher than the averaging method (0.9373), 3.47%
changes. Quantitative assessment showed that the PSO-EP higher than stacking (0.9246), and 2.36% higher than
achieved an R of 0.9492 (Table 8), again leading all models, ELGA (0.9346). These notable improvements stem from
2
with RMSE and MAE metrics below those of competitors; the PSO algorithm’s effective global optimization ability.
Volume 4 Issue 3 (2025) 9 doi: 10.36922/MSAM025220036