
Page 68 - MSAM-4-3
P. 68
Materials Science in Additive Manufacturing Bead geometry prediction in laser-arc AM
A B
C D
E
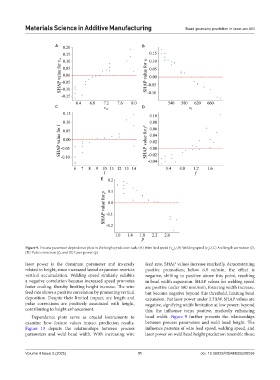
Figure 9. Process parameter dependence plots in the height prediction task: (A) Wire feed speed (v ), (B) Welding speed (v ), (C) Arc length correction (l),
t
w
(D) Pulse correction (f), and (E) Laser power (p)
laser power is the dominant parameter and inversely feed rate, SHAP values increase markedly, demonstrating
related to height, since increased lateral expansion restricts positive promotion; below 6.9 m/min, the effect is
vertical accumulation. Welding speed similarly exhibits negative, shifting to positive above this point, resulting
a negative correlation because increased speed promotes in bead width expansion. SHAP values for welding speed
faster cooling, thereby limiting height increase. The wire are positive under 580 mm/min, fostering width increase,
feed rate shows a positive correlation by promoting vertical but become negative beyond this threshold, limiting bead
deposition. Despite their limited impact, arc length and expansion. For laser power under 2.3 kW, SHAP values are
pulse corrections are positively associated with height, negative, signifying width limitation at low power; beyond
contributing to height enhancement. this, the influence turns positive, markedly enhancing
Dependence plots serve as crucial instruments to bead width. Figure 9 further presents the relationships
examine how feature values impact prediction results. between process parameters and weld bead height. The
Figure 13 depicts the relationships between process influence patterns of wire feed speed, welding speed, and
parameters and weld bead width. With increasing wire laser power on weld bead height prediction resemble those
Volume 4 Issue 3 (2025) 11 doi: 10.36922/MSAM025220036