
Page 77 - MSAM-4-3
P. 77
Materials Science in Additive Manufacturing Interpretable GP melt track prediction
Figure 1. Geometric prediction and morphology classification model of the melt track based on DGP and softmax
Abbreviations: MP: Melt pool; DGP-p: DGP model using physical kernel; W: Melt track width; δ: Small perturbation; H: Melt track height
2. Experiment and methods
2.1. Experimental setup
In this study, the laser powder bed fusion (LPBF) system was
set up based on existing LPBF equipment for modification,
incorporating high-speed cameras, zoom lenses, and
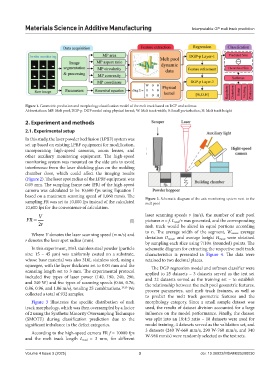
other auxiliary monitoring equipment. The high-speed
monitoring system was mounted on the side axis to avoid
interference from the laser shielding glass on the molding
chamber door, which could affect the imaging results
(Figure 2). The laser spot radius of the LPBF equipment was
0.05 mm. The sampling frame rate (FR) of the high-speed
camera was calculated to be 10,600 fps using Equation I
based on a maximum scanning speed of 1,060 mm/s. The Figure 2. Schematic diagram of the axis monitoring system next to the
sampling FR was set to 10,000 fps instead of the calculated melt pool
10,600 fps for the convenience of calculation.
V laser scanning speeds v (m/s), the number of melt pool
FR = (I) pictures n = f. L total/v was generated, and the corresponding
r 2 melt track would be sliced in equal portions according
to n. The average width of the segment, W mean, average
Where V denotes the laser scanning speed (mm/s) and
r denotes the laser spot radius (mm). deviation D mean, and average height H mean were obtained
by sampling each slice using 7/10n (rounded) points. The
In this experiment, 316L stainless steel powder (particle schematic diagram for extracting the respective melt track
size: 15 – 45 μm) was uniformly coated on a substrate, characteristics is presented in Figure 4. The data were
whose base material was also 316L stainless steel, using a retained to two decimal places.
squeegee, with the layer thickness set to 0.04 mm and the The DGP regression model and softmax classifier were
scanning length set to 3 mm. The experimental protocol applied to 25 datasets – 3 datasets served as the test set
included five types of laser power (140, 190, 240, 290, and 22 datasets served as the training set – to establish
and 340 W) and five types of scanning speeds (0.66, 0.76, the relationship between the melt pool geometric features,
0.86, 0.96, and 1.06 m/s), totaling 25 combinations. 19,20 We process parameters, and melt track features, as well as
collected a total of 932 samples. to predict the melt track geometric features and the
Figure 3 illustrates the specific distribution of melt morphology category. Since a small sample dataset was
track morphology, which was then oversampled by a factor used, the results of dataset division accounted for a large
of 2 using the Synthetic Minority Oversampling Technique influence on the model performance. Finally, the dataset
(SMOTE) during classification prediction due to the was split into an 18:4:3 ratio – 18 datasets were used for
significant imbalance in the defect categories. model training, 4 datasets served as the validation set, and
3 datasets (240 W-660 mm/s, 290 W-760 mm/s, and 340
According to the high-speed camera FR f = 10000 fps
and the melt track length L total = 3 mm, for different W-960 mm/s) were randomly selected as the test sets.
Volume 4 Issue 3 (2025) 3 doi: 10.36922/MSAM025200030