
Page 79 - MSAM-4-3
P. 79
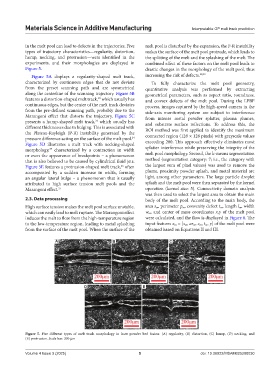
Materials Science in Additive Manufacturing                            Interpretable GP melt track prediction


            in the melt pool can lead to defects in the trajectories. Five   melt pool is disturbed by the expansion, the P-R instability
            types of trajectory characteristics—regularity, distortion,   makes the surface of the melt pool protrude, which leads to
            hump, necking, and protrusion—were identified in the   the splitting of the melt and the splashing of the melt. The
            experiments, and their morphologies are displayed in   combined effect of these factors on the melt pool leads to
            Figure 5.                                          drastic changes in the morphology of the melt pool, thus

              Figure  5A displays a regularity-shaped melt track,   increasing the risk of defects. 28,29
            characterized by continuous edges that do not deviate   To fully characterize the melt pool geometry,
            from the preset scanning path and are symmetrical   quantitative analysis was performed by extracting
            along the centerline of the scanning trajectory. Figure 5B   geometrical parameters, such as aspect ratio, roundness,
            features a distortion-shaped melt track,  which usually has   and convex defects of the melt pool. During the LPBF
                                           22
            continuous edges, but the center of the melt track deviates   process, images captured by the high-speed camera in the
            from the pre-defined scanning path, probably due to the   side-axis monitoring system are subject to interference
            Marangoni effect that distorts the trajectory.  Figure  5C   from intense metal powder splatter, plasma plumes,
            presents a hump-shaped melt track,  which usually has   and substrate surface  reflections. To address this, the
                                          23
            different thicknesses due to bulging. This is associated with   ROI method was first applied to identify the maximum
            the Plateau-Rayleigh (P-R) instability generated by the   connected region (128 × 128 pixels) with grayscale values
            pressure difference acting on the surface of the melt pool.
                                                         24
            Figure  5D illustrates a melt track with necking-shaped   exceeding 200. This approach effectively eliminates most
            morphology,  characterized by a contraction in width   splatter interference while preserving the integrity of the
                      25
            or even the appearance of breakpoints – a phenomenon   melt pool morphology. Second, the k-means segmentation
            that is also believed to be caused by cylindrical fluid jets.   method (segmentation category: 7; i.e., the category with
            Figure 5E features a protrusion-shaped melt track,  often   the largest sum of pixel values) was used to remove the
                                                    26
            accompanied by a sudden increase in width, forming   plume, proximity powder splash, and metal material arc
            an angular lateral bulge – a phenomenon that is usually   light, among other parameters. The large particle droplet
            attributed to high surface tension melt pools and the   splash and the melt pool were then separated by the kernel
            Marangoni effect. 27                               operation (kernel size: 5). Connectivity domain analysis
                                                               was then used to select the largest area to obtain the main
            2.3. Data processing                               body of the melt pool. According to the main body, the
            High surface tension makes the melt pool surface unstable,   area s m, perimeter p m, convexity defect t m, length l m, width
            which can easily lead to melt rupture. The Marangoni effect   w m, and center of mass coordinates x,y of the melt pool
            induces the melt to flow from the high-temperature region   were calculated, and the flow is displayed in Figure 6. The
            to the low-temperature region, leading to metal splashing   input features x m = [s m, ar m, c m, t m, y] of the melt pool were
            from the surface of the melt pool. When the surface of the   obtained based on Equations II and III.

                         A                       B                       C


                                     D                        E


            Figure  5. Five different types of melt track morphology in laser powder bed fusion: (A) regularity, (B) distortion, (C) hump, (D) necking, and
            (E) protrusion. Scale bar: 200 μm


            Volume 4 Issue 3 (2025)                         5                         doi: 10.36922/MSAM025200030