
Page 84 - MSAM-4-3
P. 84
Materials Science in Additive Manufacturing Interpretable GP melt track prediction
A B
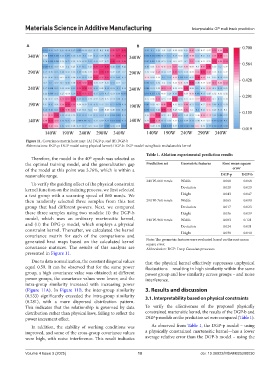
Figure 11. Covariance matrix heat map: (A) DGP-p, and (B) DGP-b
Abbreviations: DGP-p: DGP model using physical kernel; DGP-b: DGP model using basic mahalanobis kernel
Table 1. Ablation experimental prediction results
Therefore, the model in the 40 epoch was selected as
th
the optimal training model, and the generalization gap Prediction set Geometric features Root mean square
of the model at this point was 3.76%, which is within a error
reasonable range. DGP‑p DGP‑b
240 W-660 mm/s Width 0.060 0.068
To verify the guiding effect of the physical constraint
kernel function on the training process, we first selected Deviation 0.020 0.023
a test group with a scanning speed of 860 mm/s. We Height 0.043 0.047
then randomly selected three samples from this test 290 W-760 mm/s Width 0.065 0.090
group that had different powers. Next, we compared Deviation 0.017 0.023
these three samples using two models: (i) the DGP-b Height 0.036 0.039
model, which uses an ordinary martensitic kernel, 340 W-960 mm/s Width 0.083 0.121
and (ii) the DPG-p model, which employs a physical Deviation 0.024 0.031
constraint kernel. Thereafter, we calculated the kernel
covariance matrix for each of the comparisons and Height 0.038 0.040
generated heat maps based on the calculated kernel Note: The geometric features were evaluated based on the root mean
square error.
covariance matrices. The results of this analysis are Abbreviation: DGP: Deep Gaussian processes
presented in Figure 11.
Due to data normalization, the constant diagonal values that the physical kernel effectively suppresses unphysical
equal 0.59. It can be observed that for the same power fluctuations – resulting in high similarity within the same
group, a high covariance value was obtained; at different power group and low similarity across groups – and noise
power groups, the covariance values were lower; and the interference.
intra-group similarity increased with increasing power
(Figure 11A). In Figure 11B, the inter-group similarity 3. Results and discussion
(0.533) significantly exceeded the intra-group similarity 3.1. Interpretability based on physical constraints
(0.281), with a more dispersed distribution pattern.
This indicates that the relationship is governed by data To verify the effectiveness of the proposed physically
distribution rather than physical laws, failing to reflect the constrained martensitic kernel, the results of the DGP-b and
power increment effect. DGP-p models on the prediction set were compared (Table 1).
In addition, the stability of working conditions was As observed from Table 1, the DGP-p model – using
improved, and some of the cross-group covariance values a physically constrained martensitic kernel—has a lower
were high, with noise interference. This result indicates average relative error than the DGP-b model – using the
Volume 4 Issue 3 (2025) 10 doi: 10.36922/MSAM025200030