
Page 88 - MSAM-4-3
P. 88
Materials Science in Additive Manufacturing Interpretable GP melt track prediction
sparsity. In contrast, the SVR model achieves superior height, and deviation predictions for the other groups
performance by balancing global trend capture with were 8.06%, 14.45%, and 9.59% (for 240 W-660 mm/s)
moderate local mutation sensitivity. The DGP-based melt and 8.13%, 11.60%, and 9.39% (for 290 W-760 mm/s),
track geometric feature prediction model is guided by with average relative errors of 8.69%, 14.02%, and
multilayer non-linear hidden variable transfer and physical 9.73%, respectively.
principles, ensuring the capability to accommodate
sudden local offsets while predicting global trends. This The DGP model demonstrates the highest accuracy
approach mitigates purely data-driven overfitting risks, in melt track width prediction. However, deviation
enforces physical law compliance in predictions, and predictions deteriorate significantly, while height
enhances model interpretability. Due to its multilayer predictions display the poorest performance. Notably,
th
architecture, uncertainty propagates layer-wise through under higher energy density, the 24 group (refers to 340
kernel functions from initially hidden variables, resulting W-960 mm/s) exhibited larger average relative errors than
in marginally expanded confidence intervals compared to the other two groups. This degradation may be attributable
traditional GP models. to three factors: (i) the melt pool behavioral pattern
However, the impact of the transmission of changes under high power, invalidating Equation X to
uncertain hidden variables is significantly reduced this process parameter; (ii) the assumption of Equation IX
through the introduction of physical constraints. The on the height is relatively simple and does not sufficiently
predicted average width of the melt track was 123.55 take into account the actual physical process; and (iii) the
μm and the average height was 28.29 μm, comparable height of the melt track is sensitive to changes in the melt
to the actual geometry of the melt track by 9.89% and pool aspect ratio, and the optimal time lag value of the
16.03%, respectively, with a relative error of 10.21% in melt pool aspect ratio is 2, resulting in deterioration in the
the average deviation. The relative errors in the width, prediction effect.
A B
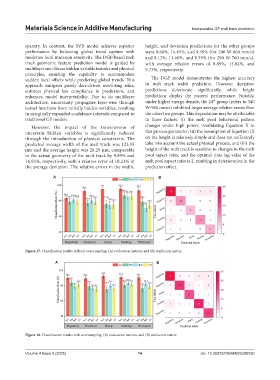
Figure 17. Classification results without oversampling: (A) evaluation metrics; and (B) confusion matrix
A B
Figure 18. Classification results with oversampling: (A) evaluation metrics, and (B) confusion matrix
Volume 4 Issue 3 (2025) 14 doi: 10.36922/MSAM025200030