
Page 90 - MSAM-4-3
P. 90
Materials Science in Additive Manufacturing Interpretable GP melt track prediction
A B C
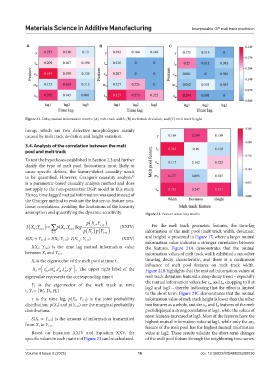
Figure 21. Delay mutual information matrix: (A) melt track width, (B) melt track deviation, and (C) melt track height
hump, which are two defective morphologies mainly
caused by melt track deviation and height variation.
3.4. Analysis of the correlation between the melt
pool and melt track
To test the hypotheses established in Section 2.3 and further
clarify the type of melt pool fluctuations most likely to
cause specific defects, the feature-defect causality needs
to be quantified. However, Granger’s causality analysis
39
is a parametric-based causality analysis method and does
not apply to the non-parametric DGP model in this study.
Hence, time-lagged mutual information was used instead of
the Granger method to evaluate the feature-to-feature non-
linear correlations, avoiding the limitations of the linearity
assumption and quantifying the dynamic sensitivity. Figure 22. Feature sensitivity matrix
t (
pX Y,
t (
τ
IX Y; t + ) = ∑ p XY( t , t +τ ) log pX pY ( t + ) (XXIV) For the melt track geometric features, the time-lag
τ
XY , t ( ) t + ) information of the melt pool (melt track width, deviation,
τ
S(X t → Y t+τ) = I(X t; Y t+τ)–I(X t ; Y t+τ) (XXV) and height) is presented in Figure 17, where a larger mutual
-1 information value indicates a stronger correlation between
I(X t; Y t+τ) is the time lag mutual information value the features. Figure 21A demonstrates that the mutual
between X t and Y t+τ. information values of melt track width exhibited a smoother
X t is the eigenvector of the melt pool at time t. time-lag decay characteristic, and there is a continuous
influence of melt pool features on melt track width.
t
s ar ct ,,
t
X = , m t , t m t m y , The upper right label of the Figure 21B highlights that the mutual information values of
m
t
eigenvalue represents the corresponding time t melt track deviation featured a steep decay trend – especially
the mutual information values for c m and t m dropping to 0 at
Y t is the eigenvector of the melt track at time
t, Y t = [W t, D t, H t] lag2 and lag3 – thereby indicating that the effect is limited
to the short term. Figure 21C demonstrates that the mutual
τ is the time lag, p(X t, Y t+τ) is the joint probability information value of melt track height is lower than the other
distribution. p(X t) and p(Y t+τ) are the marginal probability two features as a whole, and the s m and t m features of the melt
distributions. pool displayed a strong correlation at lag1, while the values of
most features increased at lag3. Most of the features have the
S(X t → Y t+τ) is the amount of information transmitted
from X t to Y t+τ. highest mutual information value at lag1, while only the ar m
feature of the melt pool has the highest mutual information
Based on Equation XXIV and Equation XXV, the value at lag2. These results validate the short-term changes
specific values in each matrix of Figure 21 can be calculated. of the melt pool feature through the neighboring time series.
Volume 4 Issue 3 (2025) 16 doi: 10.36922/MSAM025200030