
Page 78 - MSAM-4-3
P. 78
Materials Science in Additive Manufacturing Interpretable GP melt track prediction
A B
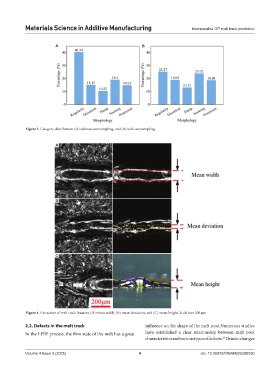
Figure 3. Category distribution: (A) without oversampling, and (B) with oversampling
A
B
C
Figure 4. Extraction of melt track features: (A) mean width, (B) mean deviation, and (C) mean height. Scale bar: 200 μm
2.2. Defects in the melt track influence on the shape of the melt pool.Numerous studies
In the LPBF process, the flow state of the melt has a great have established a clear relationship between melt pool
characteristics and various types of defects. Drastic changes
21
Volume 4 Issue 3 (2025) 4 doi: 10.36922/MSAM025200030