
Page 43 - TD-1-1
P. 43
Tumor Discovery A bioinformatics analysis of PD-1 in cancers
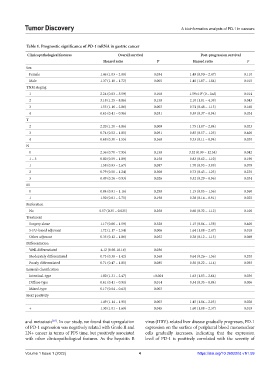
Table 1. Prognostic significance of PD‑1 mRNA in gastric cancer
Clinicopathological features Overall survival Post‑progression survival
Hazard ratio P Hazard ratio P
Sex
Female 1.46 (1.03 – 2.08) 0.034 1.49 (0.90 – 2.47) 0.110
Male 1.37 (1.10 – 1.72) 0.005 1.40 (1.07 – 1.84) 0.015
TNM staging
1 2.24 (0.83 – 5.59) 0.100 1.59×10 (0 – Inf) 0.014
9
2 3.18 (1.25 – 8.06) 0.150 2.10 (1.01 – 4.39) 0.043
3 1.55 (1.16 – 2.06) 0.003 0.74 (0.48 – 1.13) 0.160
4 0.63 (0.41 – 0.96) 0.031 0.59 (0.37 – 0.94) 0.024
T
2 2.20 (1.20 – 4.06) 0.009 1.75 (1.07 – 2.84) 0.023
3 0.74 (0.52 – 1.05) 0.091 0.85 (0.57 – 1.25) 0.400
4 0.68 (0.30 – 1.55) 0.360 0.33 (0.11 – 0.94) 0.030
N
0 2.36 (0.70 – 7.95) 0.150 3.52 (0.99 – 12.54) 0.042
1 – 3 0.80 (0.59 – 1.09) 0.150 0.83 (0.62 – 1.10) 0.190
1 1.58 (0.93 – 2.67) 0.087 1.70 (0.93 – 3.09) 0.079
2 0.79 (0.50 – 1.24) 0.300 0.73 (0.43 – 1.23) 0.230
3 0.49 (0.26 – 0.93) 0.026 0.52 (0.29 – 0.96) 0.034
M
0 0.84 (0.91 – 1.16) 0.290 1.15 (0.85 – 1.56) 0.360
1 1.50 (0.81 – 2.75) 0.190 0.38 (0.16 – 0.91) 0.025
Perforation
No 0.57 (0.35 – 0.025) 0.250 0.60 (0.32 – 1.12) 0.100
Treatment
Surgery alone 1.17 (0.86 – 1.59) 0.320 1.15 (0.84 – 1.58) 0.400
5-FU-based adjuvant 1.72 (1.17 – 2.54) 0.006 1.64 (1.08 – 2.47) 0.018
Other adjuvant 0.35 (0.12 – 1.06) 0.052 0.38 (0.12 – 1.13) 0.069
Differentiation
Well-differentiated 4.12 (0.98-18.16) 0.036
Moderately differentiated 0.73 (0.38 – 1.42) 0.360 0.64 (0.26 – 1.56) 0.320
Poorly differentiated 0.71 (0.47 – 1.05) 0.085 0.50 (0.22 – 1.14) 0.093
Lauren’s classification
Intestinal-type 1.80 (1.31 – 2.47) <0.001 1.63 (1.03 – 2.64) 0.036
Diffuse-type 0.61 (0.41 – 0.91) 0.014 0.54 (0.35 – 0.84) 0.006
Mixed-type 0.17 (0.04 – 0.63) 0.003
Her2 positivity
− 1.49 (1.14 – 1.95) 0.003 1.45 (1.04 – 2.03) 0.028
+ 1.30 (1.01 – 1.69) 0.045 1.60 (1.08 – 2.37) 0.019
and metastasis . In our study, we found that upregulation virus (HBV)-related liver disease gradually progresses, PD-1
[20]
of PD-1 expression was negatively related with Grade II and expression on the surface of peripheral blood mononuclear
LN+ cancer in terms of PPS time, but positively associated cells gradually increases, indicating that the expression
with other clinicopathological features. As the hepatitis B level of PD-1 is positively correlated with the severity of
Volume 1 Issue 1 (2022) 4 https://doi.org/10.36922/td.v1i1.59