
Page 41 - TD-2-1
P. 41
Tumor Discovery Breast cancer optical differentiation
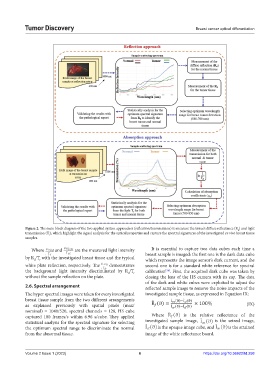
Figure 2. The main block diagram of the two applied system approaches (reflection/transmission) to measure the tissue’s diffuse reflectance (R ) and light
d
transmission (T), which highlight the signal analysis for the optical properties and capture the spectral signatures of the investigated ex vivo breast tissue
r
samples.
Where and are the measured light intensity It is essential to capture two data cubes each time a
by R /T with the investigated breast tissue and the typical breast sample is imaged: the first one is the dark data cube
which represents the image sensor’s dark current, and the
r
d
white plate reflection, respectively. The demonstrates second one is for a standard white reference for spectral
the background light intensity discriminated by R /T r calibration . First, the acquired dark cube was taken by
[56]
d
without the sample reflection on the plate. closing the lens of the HS camera with its cap. The data
of the dark and white cubes were exploited to adjust the
2.6. Spectral arrangement reflected sample image to remove the noise impacts of the
The hyper spectral images were taken for every investigated investigated sample tissue, as expressed in Equation IX:
breast tissue sample from the two different arrangements
as explained previously with spatial pixels (max/ (IX)
nominal) = 1040/520, spectral channels = 128, HS cube
captured 100 frames/s within 6.96 s/cube. They applied Where is the relative reflectance of the
statistical analysis for the spectral signature for selecting investigated sample image, is the seized image,
the optimum spectral range to discriminate the normal is the opaque image cube, and is the attained
from the abnormal tissue. image of the white reflectance board.
Volume 2 Issue 1 (2023) 6 https://doi.org/10.36922/td.258